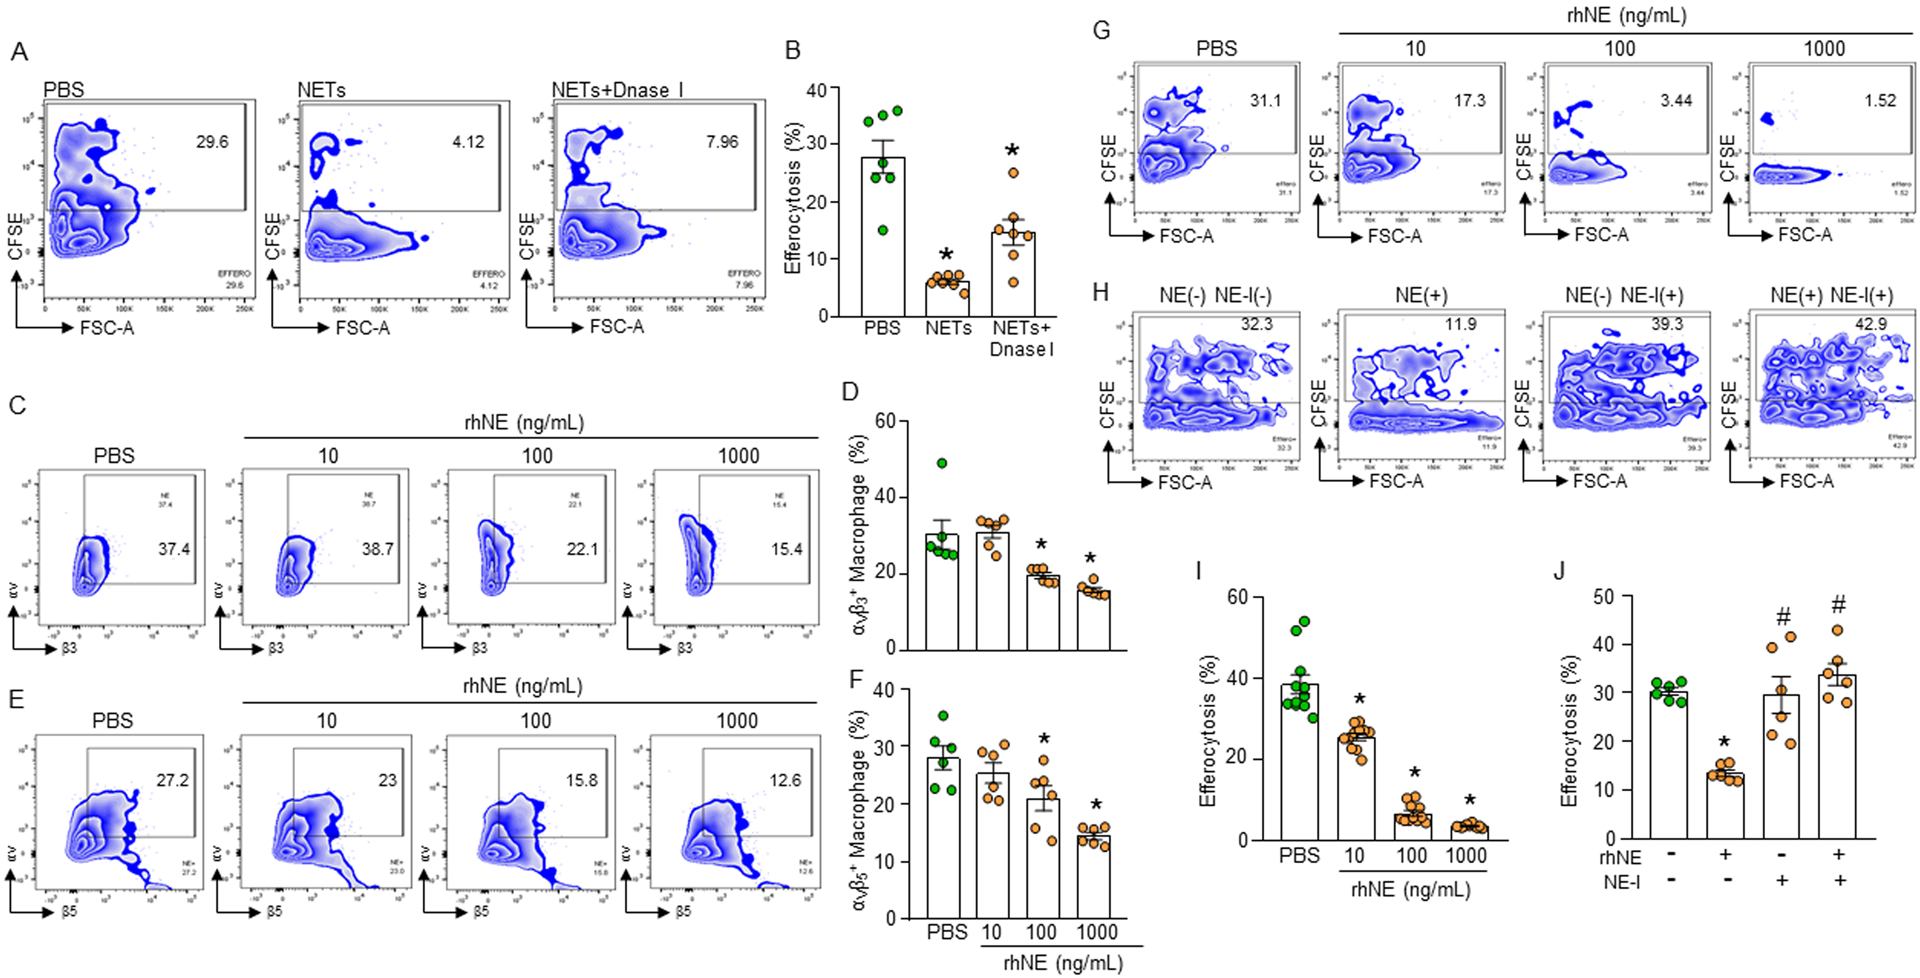
Figure 4: NE cleaves integrins causing impaired efferocytosis.

(A, B) Murine peritoneal macrophages (5 × 10⁵) were cultured with CFSE-stained apoptotic cells (1.5 × 10⁶) in presence of NETs (1000 ng/mL) and DNase I (500U/mL). After 1 h of cell culture, the cells were washed and stained with PE-F4/80 Ab and assessed efferocytosis using flow cytometry. (C-F) Assessment of surface expression of integrins following treatment of the macrophages with various doses of rmNE. After treatment of the peritoneal macrophages (5 × 10⁵) with rmNE for 4 h the cells were washed and stained with (C, D) anti-αvβ3 and (E, F) αvβ5 integrin Abs and assessed their expression by flow cytometry. (G, I) Peritoneal macrophages (5 × 10⁵) and CFSE-labeled apoptotic cells (1.5 × 10⁶) were co-cultured in the presence of various doses of rmNE. After 1 h, the cells were washed and stained with PE-F4/80 Ab and the efferocytosis was assessed by flow cytometry. Data were obtained from 3 independent experiments and expressed as means ± SE (n=7–9 samples/group). The groups were compared by one-way ANOVA and SNK method. *p<0.05 vs. PBS-treated macrophages. (H, J) Peritoneal macrophages (5 × 10⁵) and CFSE-labeled apoptotic cells (1.5 × 10⁶) were co-cultured in the presence of rmNE (1000 ng/mL) with or without NE-I (100 μM). After 1 h, the cells were washed and stained with PE-F4/80 Ab and assessed efferocytosis by flow cytometry. Data were obtained from 3 independent experiments and expressed as means ± SE (n=6 samples/group). The groups were compared by one-way ANOVA and SNK method. *p<0.05 vs. NE(−) NE-I(−); #p<0.05 vs. NE(+) NE-I(−). NE, neutrophil elastase; NE-I, NE-inhibitor.
