FIGURE 3:
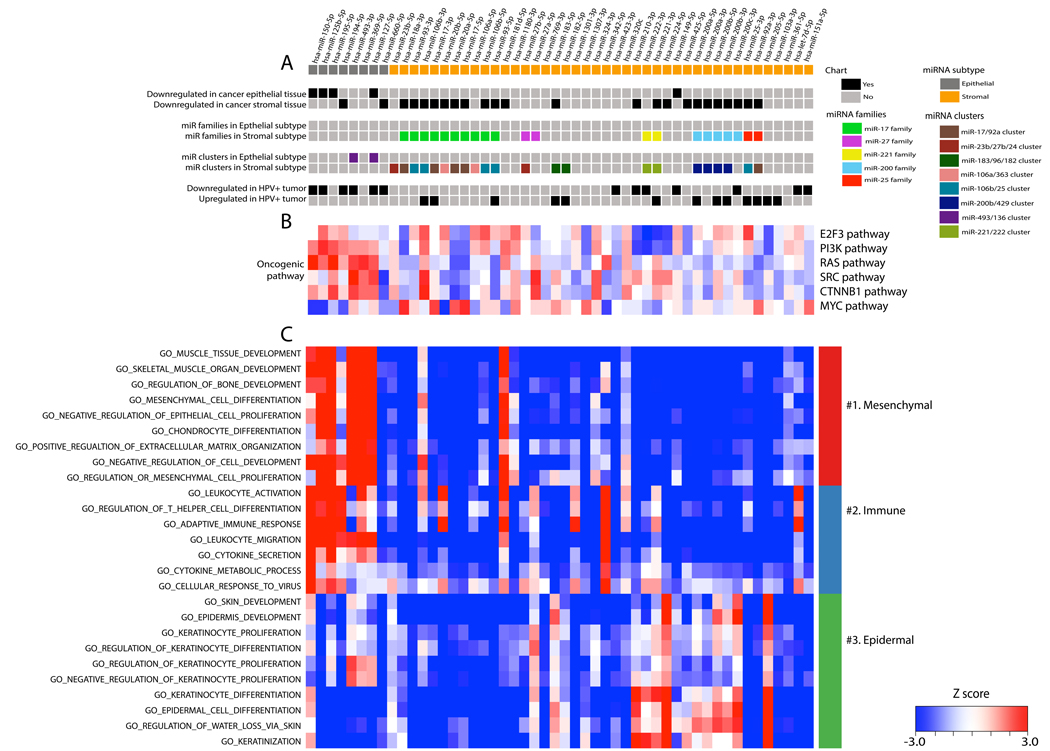
Two miRNA clusters display the distinct phenotypes of epithelial cancers. (A) The upper chart illustrates the association of 50 miRNAs with phenotypes of epithelial cancer, as well as known-miRNA clusters and families based on previously published papers (also see Supplementary Table S3B) and differentially expressed miRNAs between HPV(+) and HPV(–) tumors (also see Supplementary Table S5C). (B) The middle heatmap illustrates the extent of correlation between miRNAs in the TCGA cohort and the primary airway cell oncogenic mRNA signatures of the E2F3, PIK3CA, RAS, SRC, WNT, and MYC pathways. Red and blue represent positive and negative correlations, respectively. (C) The extent of correlation between the 50 microRNAs in the TCGA cohort and a manually curated set of GO categories was calculated and rendered as the lower heatmap. Red and blue represent positive and negative correlation between the corresponding miRNA and genes in the GO category, respectively. The GO categories are colored as groups with related functional annotations.

