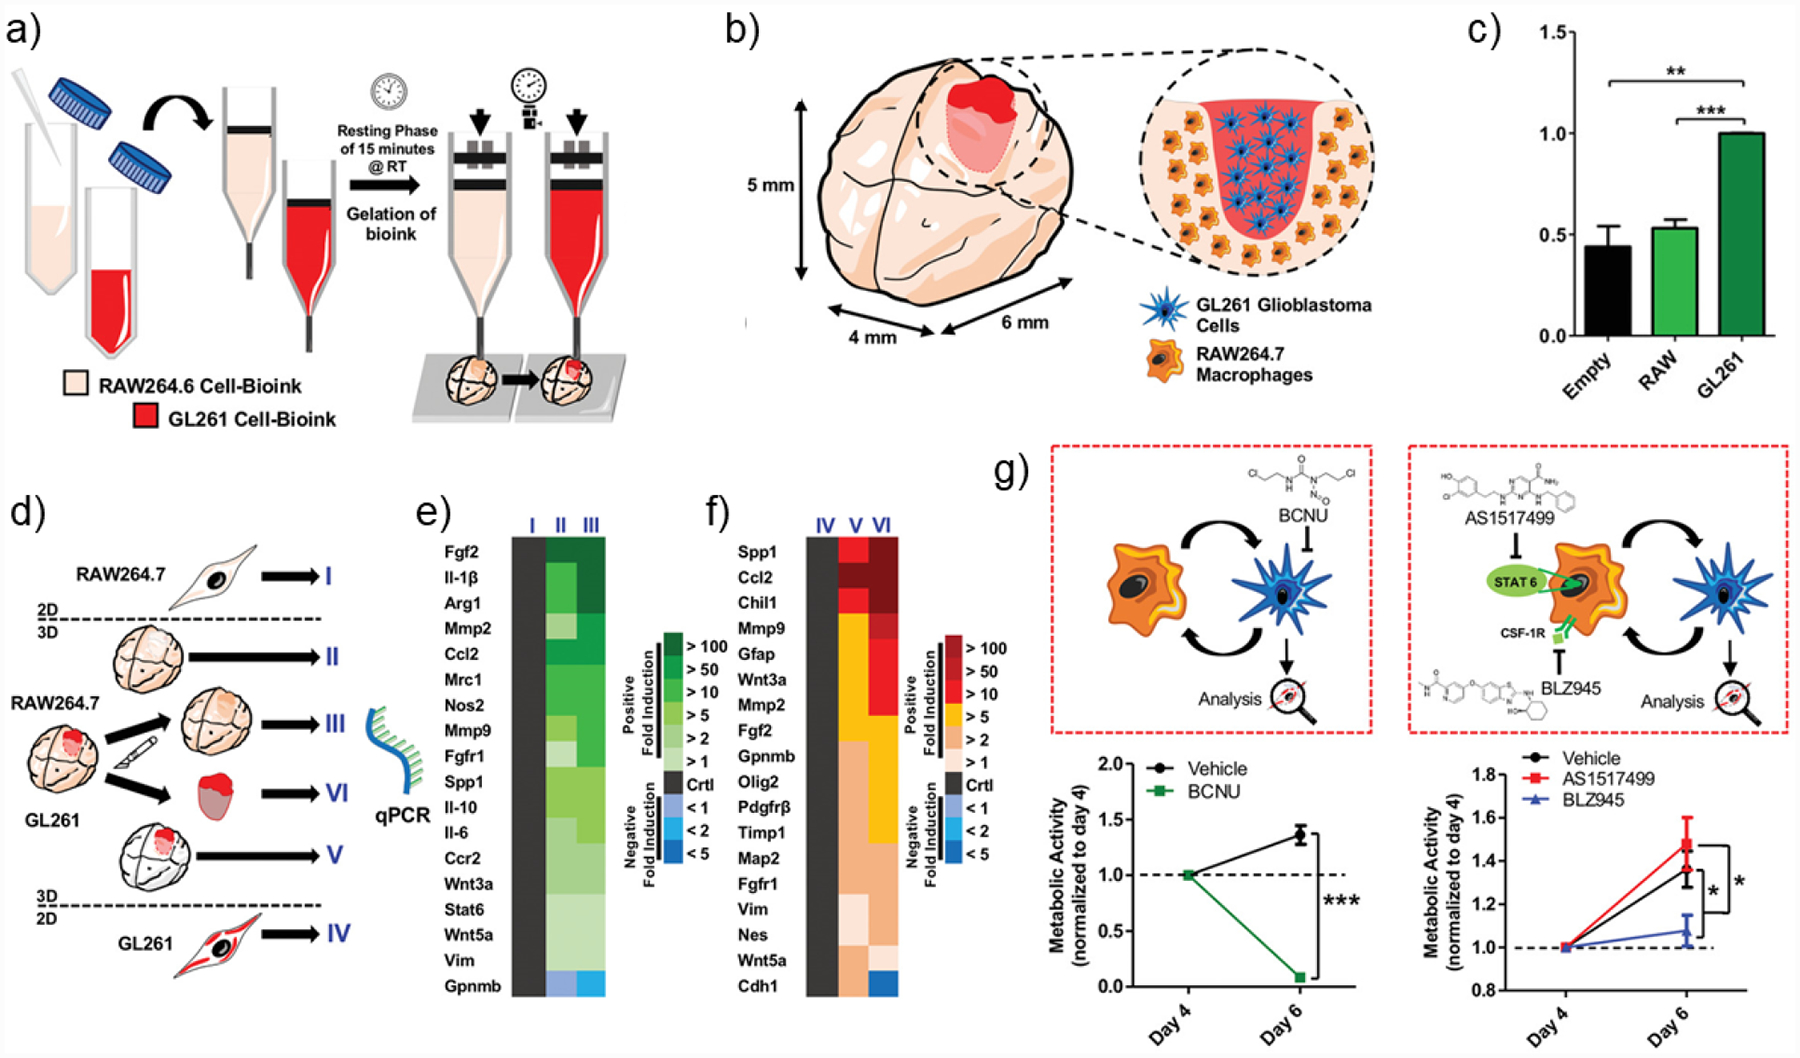
Figure 5.

Schematic representation of the bioprinting process and features of a co-culture GBM model. a) Preparation of the GelMA-gelatin two bioinks encapsulated with RAW264.7 mouse macrophages GL261 mouse GBM cells, respectively. Co-culture model was fabricated by a two-step bioprinting process. b) Co-culture model and its cross-sectional view. The brain was bioprinted with RAW264.7, and the cavity was filled with GL261. c) Quantification for macrophage migration toward empty control, RAW (macrophages), and GL261 (GBM cells). **p < 0.01, ***p < 0.001. d) Schematic of the experimental groups for the co-culture model. e,f) Gene expression of RAW264.7 in (I) 2D culture, (II) 3D mono-culture, and (III) 3D co-culture, and of GL261 in (IV) 2D culture, (V) 3D mono-culture, and (VI) 3D co-culture model. g) Drug evaluation using the co-culture model. Schematic illustration of BCNU, AS1517499, or BLZ945 treatment to the co-culture GBM-macrophage model and measured metabolic activities of GL261 after 3D co-culture and treatment, respectively. Copyright Wiley, 2019.[185] Reproduced with permission.
