
Extended Data Fig. 8. Effect of myelomonocytic cells on cerebral repair and angiogenesis.
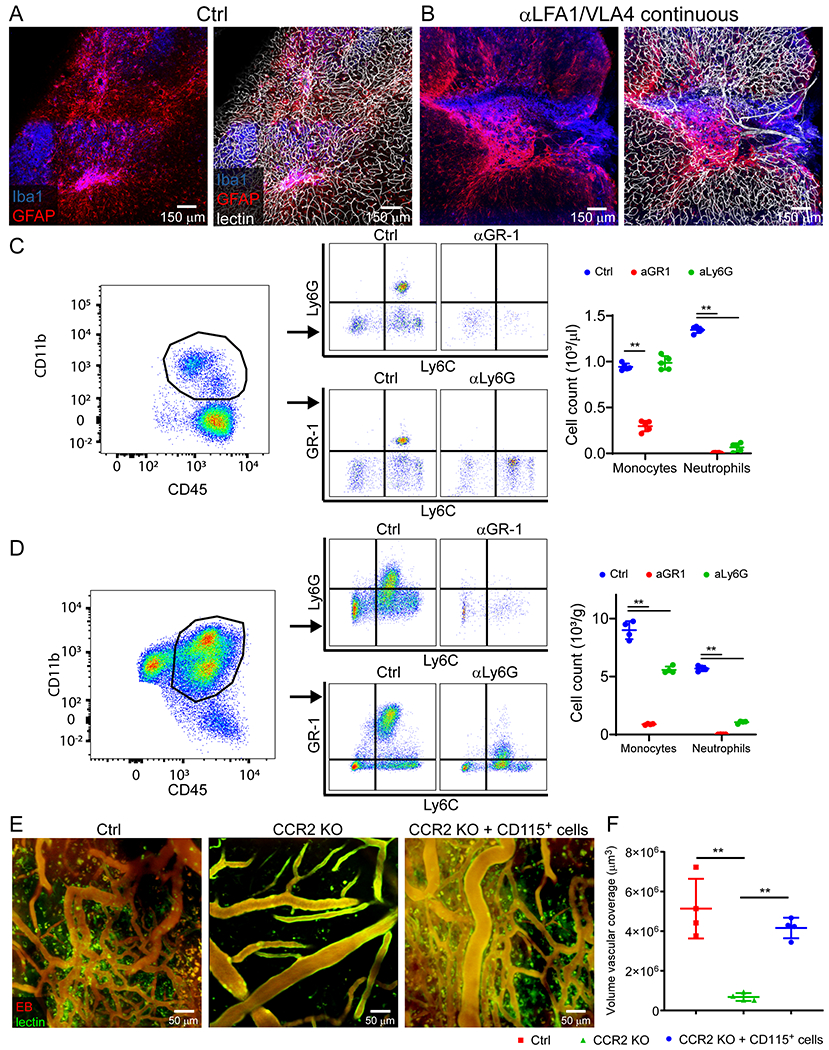
A, B. Confocal microscopy of cerebral cortex 10 days after injury shows areas of gliosis (GFAP, blue) and microglia clustering (Iba-1, red) relative to tomato-lectin+ vasculature. Mice were treated continuously with either isotype control (A) or αLFA1/VLA4 (B) antibodies. Continuous treatment with αLFA1/VLA4 results in large areas of brain tissue with blood vessels. Images are representative of 5 mice per group. C, D. Flow cytometric analysis and gating strategy of monocyte and neutrophil depletion in blood (C) and brain (D) following continuous treatment with GR-1 and Ly6G antibodies 6 d post-injury compared to isotype treated controls. The following panel was used: Ly6C FITC, GR-1 BV421, CD11b BV570, Cx3CR1 BV711, P2RY12 PE, CD45 BUV395, Ly6G BUV563, CD44 BUV737, CD115 APC and live/dead fixable blue cell staining kit. Plots were pre-gated for single, live cells and subsequently for CD45+CD11b+ cells. In brain samples gated, microglia were identified as CD45lowCx3Cr1+P2RY12+CD44− cells. Monocytes were identified as CD45+CD44+CD115+Ly6G-GR1low and neutrophils as CD45+CD44+CD115-Ly6G+GR1hi. In mice treated with Ly6G, Ly6G was not used to characterize cells flow cytometrically. Moreover, in mice treated with GR-1, GR-1 was not used to characterize the cells. Graphs show the mean±SD and are representative of 2 independent experiments with n=5 (C) and n=4 (D) mice per group (**P<0.01, Two-way ANOVA/Holm-Sidak test). E, F. Intravital microscopy of cerebral vasculature and image-based quantification of vascular coverage in naïve B6 mice, CCR2 KO mice and CCR2 KO mice with CD115+ monocyte adoptive transfer 10 d post-injury. Adoptive transfer of CD115+ monocytes from B6 mice partially reconstitutes the angiogenic process. Graph shows mean±SD and is representative of two independent experiments with (n=4 mice per group, **P<0.01, Kruskal-Wallis/Dunn’s test).