
Figure 2. Microglia rapidly extend processes and create a barrier surrounding injured blood vessels.
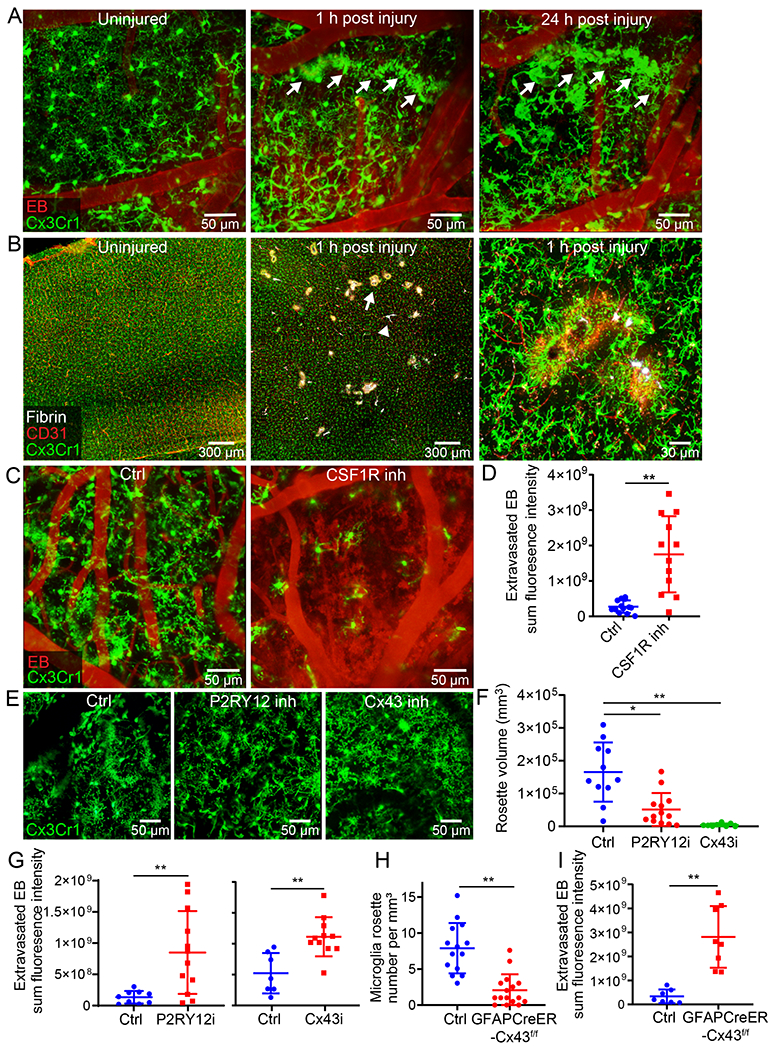
A. Intravital microscopy of CX3CR1gfp/wt mice demonstrates extension of microglia processes and rosette formation (green) 1 h after injury (white arrow denotes a microglial rosette). At 24 h, rosette-forming microglia transform into an amoeboid morphology while maintaining the pattern along the damaged vessel. EB injected i.v. is shown in red. Images are representative of 2 independent experiments with 5 mice per group (see Video 4). B. Confocal brain images of CX3CR1gfp/wt mice demonstrate petechial hemorrhages (white arrow) and clotted vessels (white arrowhead) throughout the cerebral cortex 1 h after injury. A magnified image (right) depicts microglia projections surrounding a clotted vessel. CD31 is shown in red and fluorescently tagged fibrinogen in white. Images are representative of 2 experiments with 5 mice per group. C. Intravital microscopy of CX3CR1gfp/wt (green) mice 20 min after injury shows extensive intraparenchymal EB (red) extravasation following microglia depletion (CSF1R inhibition; see Video 5). D. EB extravasation assay based on intravital microscopy time lapses depicts increased BBB leakage 20-40 min after microglia depletion. Cumulative data from 3 independent experiments (n=13 mice per group; **P=0.000062 / two-tailed Student’s t-test; 1 mouse was not processed due to poor image quality). E. Intravital microscopy of CX3CR1gfp/wt (green) mice at 20 min post-injury treated transcranially with a P2RY12 inhibitor, a Cx43 inhibitor or a vehicle control (see Video 6). F. Quantification of microglial rosettes in panel E 20 min following injury. Cumulative data from 3 independent experiments (Ctrl n=11, P2RY12i n=13, Cx43i n=9 mice; *P=0.048, **P=5.2e-6/ Kruskal-Wallis/Dunn’s test; 2 mice were not processed due to poor image quality). G. EB extravasation assay 20-40 min post-injury in mice treated transcranially with a P2RY12 inhibitor, Cx43 inhibitor or vehicle control. Left graph shows cumulative data from 2 independent experiments (Ctrl n=9, P2RY12i n=12 mice, **P=0.0048/ two-tailed Student’s t-test). Right graph shows cumulative data from 2 independent experiments (Ctrl n=7, Cx43i n=11 mice, **P=0.0015/ two-tailed Student’s t-test). (See also Extended Data Figure 4A, B and Video 7) H. Microglia rosette quantification 1 h following injury in littermate control vs. GFAPCreER-Cx43f/f mice. Cumulative data from 3 independent experiments (Ctrl n=14, GFAPCreER-Cx43f/f n=16 mice, **P=6.2e-6/ two-tailed Mann–Whitney U test; See also Extended Data Figure 4C). I. EB extravasation assay 20-40 min post-injury in littermate control vs. GFAPCreER-Cx43f/f mice. Cumulative data from 2 independent experiments (Ctrl n=7, GFAPCreER-Cx43f/f n=8 mice, **P= 0.00025/ two-tailed Student’s t-test; See also Extended Data Figure 4D and Video 8). In panels D, F, G, H, and I each symbol represents an individual mouse and graphs depict mean±SD.