
Figure 3. Vascular injury causes myelomonocytic cell invasion and subsequent cerebral edema.
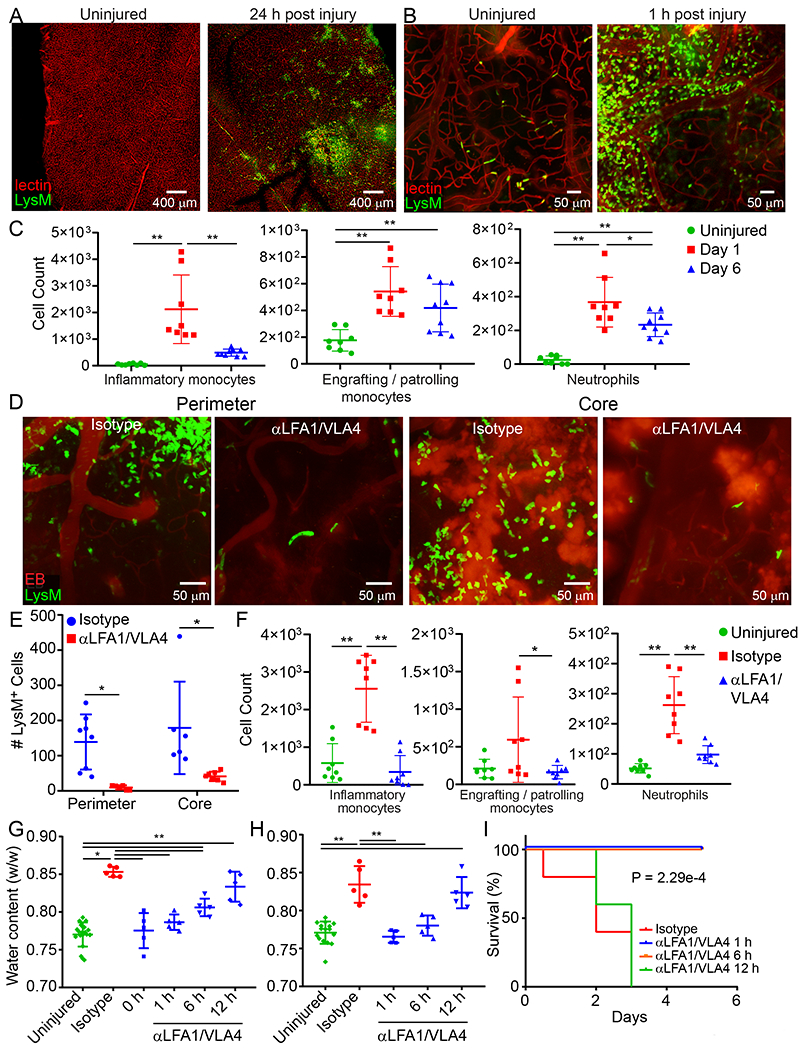
A. Confocal images of uninjured or 24 h post-injury LysMgfp/wt (green) mouse brains. Tomato-lectin is shown in red. Images are representative of 6 mice per group. B. Intravital microscopy images from LysMgfp/wt mice show rapid invasion by myelomonocytic cells (green) within 1 h of injury relative to an uninjured control. Tomato-lectin is shown in red. Images are representative of 5 mice per group (Also see Video 9). C. High parameter flow cytometric analysis of the immune landscape in the cerebral cortex of CX3CR1gfp/wt CCR2rfp/wt mice at 1 d and 6 d post-injury relative to uninjured controls was used to graph the absolute number of inflammatory monocytes (CD45+CD44+CD11b+CCR2+Ly6Chi), patrolling/engrafted monocytes (CD45+CD44+CD11b+CX3CR1+Ly6CloMHC-II+), and neutrophils (CD45+CD44+CD11b+Ly6G+Ly6Clo). Graphs show the mean±SD and are a compilation of 2 independent experiments (Ctrl n=8, d1 n=8, d6 n=9 mice, *P<0.05, **P<0.01, One-way ANOVA/Tuckey; gating strategy in Extended Figure 5A and Supplementary Figure 1B). D. Intravital microscopy images of the lesion core and perimeter at 1 h post-injury in LysMgfp/wt mice that received a bolus injection of αLFA1/VLA4 or isotype control antibodies (see also Video 10). E. Quantification of LysM+ cells that invade the lesion core and perimeter at 1 h post-injury. Graph shows the mean±SD and is representative of two independent experiments (Isotype n=8, αLFA1/VLA4 n=7 mice, *P<0.05, Perimeter P=0.025, Core P=0.019, Two-way ANOVA/Holm-Sidak test, 3 images were not processed due to poor image quality) F. High parameter flow cytometric analysis of immune landscape in the cerebral cortex of CX3CR1gfp/wtCCR2rfp/wt 1 d post-injury was used to graph the absolute number of inflammatory monocytes, patrolling monocytes, and neutrophils following a single dose of αLFA1/VLA4 or isotype control antibodies relative to uninjured control mice. Graphs show the mean±SD and represent a compilation of two independent experiments (n=8 mice per group, *P<0.05, **P<0.01, One-way ANOVA/Tuckey; gating strategy in Extended Figure 5B and Supplementary Figure 1B). G-H. Quantification of cerebral water content 1 d after anterior (G) and posterior (H) injury shows the time dependent effect of bolus αLFA1/VLA4 treatment on cerebral edema. αLFA1/VLA4 were administered at 0, 1, 6 or 12 h post-injury and compared to isotype control treated or uninjured mice (*P<0.05, **P<0.01, One-way ANOVA/Tukey test). I. Kaplan-Meier curve following posterior injury shows 100% survival of mice after αLFA1/VLA4 treatment of mice at 1 h or 6 h post-injury. The median survival is 3 d with αLFA1/VLA4 treatment 12 h after injury, and 2 d for the isotype control group (P=2.29e-4; Log-rank test). In panels G, H, and I, graphs depict the mean±SD and are representative of 2 independent experiments with n=5 mice per group. For G, H the uninjured group includes the combination of the contralateral hemispheres.