
Extended Data Fig. 3. Microglia depletion increases BBB leakage, intraparenchymal hemorrhage, myeloid cell invasion and vascular endothelium activation.
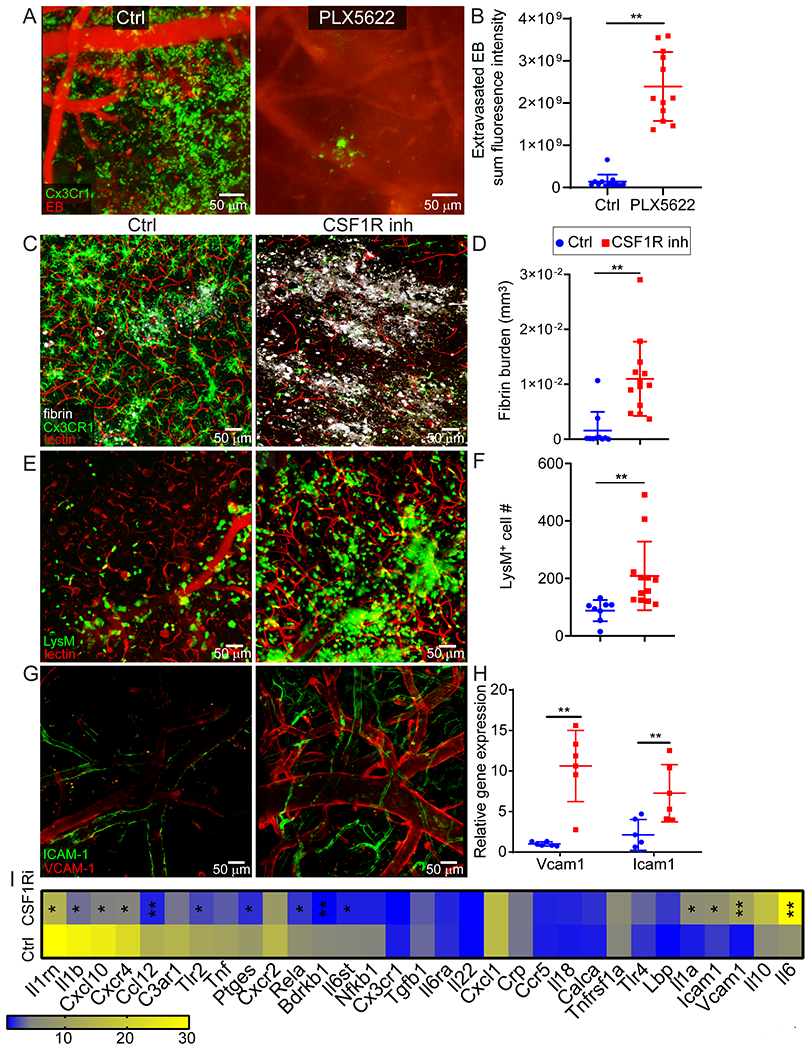
A. Intravital microscopy of CX3CR1gfp/wt (green) mice 20 min after injury shows extensive intraparenchymal EB (red) extravasation following microglia depletion using an alternate CSF1R inhibitor, PLX5622, to that used in Fig 2C, D. B. EB extravasation assay based on intravital microscopy time lapses depicts increased BBB leakage 20-40 min after microglia depletion using PLX5622. Graph depicts mean±SD of cumulative data from 2 independent experiments (n=12 mice per group, **P=3.9e-9, two-tailed Student’s t-test). C. Confocal microscopy images of cortical brain sections from of naive and microglia depleted Cx3CR1gfp/wt (green) mice 1 h following injury. Mice received an i.v. injection of fluorescent fibrinogen (white) and tomato-lectin (red). Larger and more diffuse intraparenchymal fibrinogen is observed in mice treated with PLX3397 (CSF1R inhibitor). D. Image-based quantification of fibrin burden in the brain parenchyma. Graph depicts mean±SD of cumulative data from 2 independent experiments (Ctrl n=10, CSF1R inh n=13, **P=0.00017, Mann–Whitney U test). E. Two-photon microscopy images captured in the cerebral cortex of injured LysMgfp/wt mice treated with vehicle or PLX3397 show LysM+ myelomonocytic cell (green) invasion at 20 min post-injury. Tomato-lectin is shown in red. F. Image based quantification of myelomonocytic infiltration. Graph depicts mean±SD of cumulative data from 2 independent experiments (Ctrl n=8, CSF1R inh n=12, **P=0.0002, Mann–Whitney U test). G. Intravital microscopy images in the cerebral cortex of vehicle versus PLX3397 treated B6 mice at 24 h post-injury. Prior to imaging, mice received an i.v. injection of APC-anti-CD106 (VCAM-1; red) and PE-anti-CD54 (ICAM-1; green), which revealed increased endothelial expression in PLX3397 treated mice. Representative images are from 2 independent experiments with 3 mice per group. H. qPCR analysis of ICAM and VCAM expression in vehicle vs. PLX3397 treated B6 mice at 24 h post-injury. Graph depicts mean±SD of cumulative data from 2 independent experiments (n=6 mice per group, Vcam1 P=3.58e-5, Icam1 P=0.0072, Two-way ANOVA/Holm-Sidak test). I. Heatmap shows qPCR analysis of genes encoding for acute inflammation-related proteins in vehicle vs. PLX3397-treated B6 mice. The fold increase in gene expression was calculated relative to the uninjured contralateral hemisphere for each mouse at 24 h post-injury. Data are representative of 2 independent experiments with 5 mice per group per experiment (*P<0.05, **P<0.01, multiple t tests with Holm-Sidak multiple comparisons correction, source data in Supplementary Table S3). CSF1R inh refers to PLX3397.