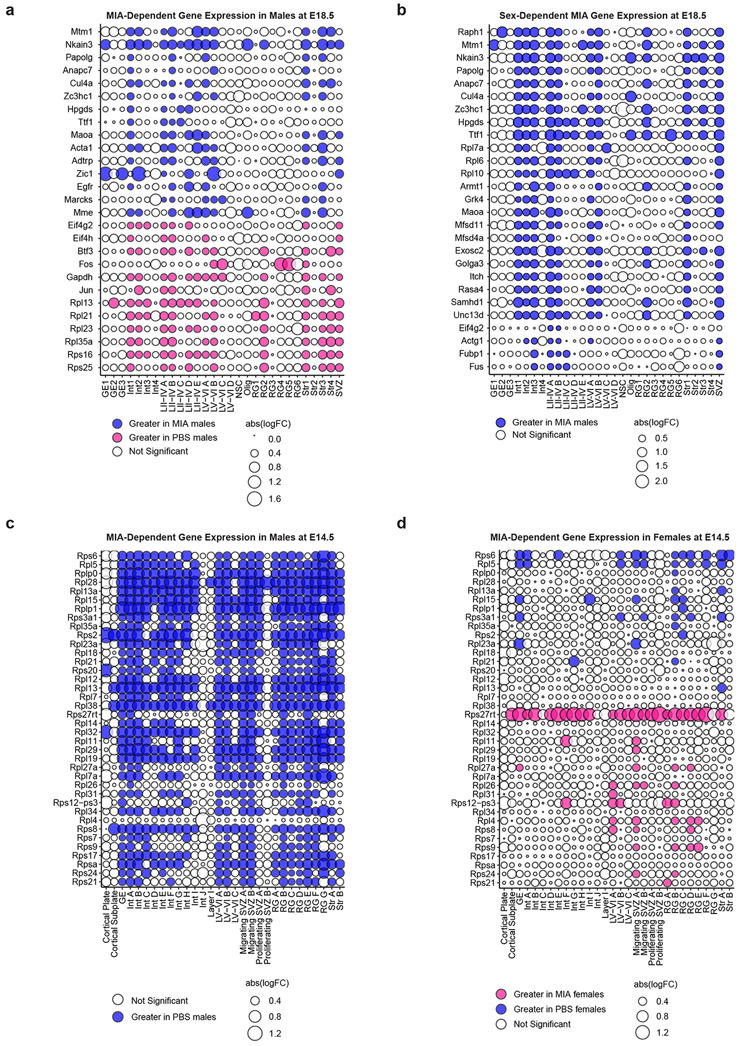
Extended Data Fig. 4. Single cell differential gene expression changes.
a, Bubble plot of highly variable genes between MIA and PBS male offspring at E18.5. All significant genes FDR < 0.05. Blue indicates an increase in MIA males relative to PBS males. Data from n = 2 mice per group.
b, Bubble plot of sex-dependent genes in MIA offspring at E18.5. All significant genes FDR < 0.05. Blue indicates an increase in Δ(MIA males – PBS males) relative to females. Data from n = 2 mice per group.
c, Bubble plot of ribosome subunit genes between MIA male and PBS male offspring at E14.5, demonstrating a widespread decrease in expression of multiple ribosomal subunits in MIA male offspring. All significant genes FDR < 0.05. Blue indicates an increase in PBS males relative to MIA males. Data from n = 2 mice per group.
d, Bubble plot of ribosome subunit genes between MIA female and PBS female offspring at E14.5, demonstrating an increase in expression of multiple ribosomal subunits in MIA female offspring. All significant genes FDR < 0.05. Blue indicates an increase in PBS females relative to MIA females. Data from n = 2 mice per group.

