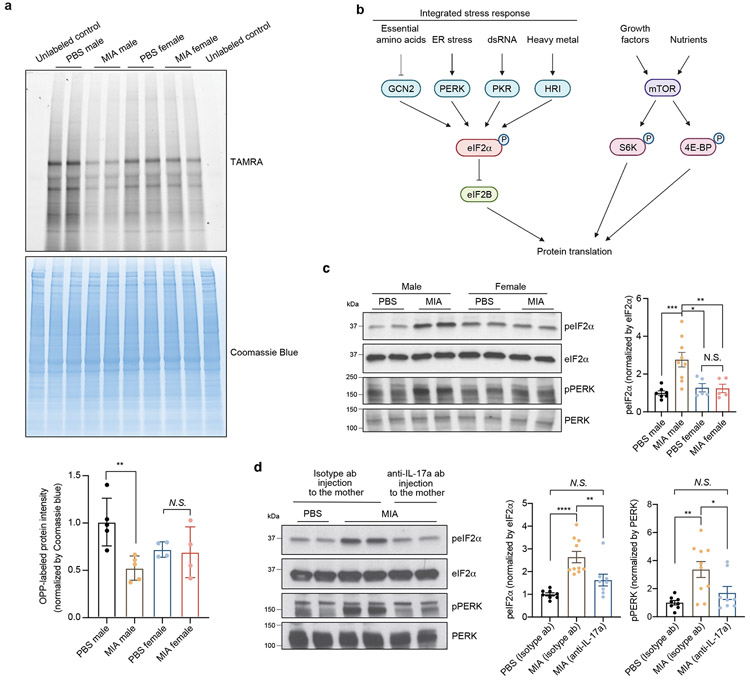
Figure 3. MIA inhibits protein translation in the fetal brain via the integrated stress response.
a, TAMRA-conjugated proteins labeled by OPP were extracted and isolated by SDS-PAGE and analyzed by fluorescence scan at 532 nm. Representative section of Coomassie-stained gel for loading comparison (Two-way ANOVA sex (male or female) × stimulus (PBS or MIA) interaction F1,14 = 5.874, P = 0.0295; effect of sex F1,14 = 0.4167, P = 0.5290; effect of stimulus F1,14 = 7.462, P = 0.0162 followed by Tukey multiple comparisons test: PBS male versus MIA male **P = 0.0082; n = 5 for PBS male and MIA male, n = 4 for PBS female and MIA female pups; 3 independent litters for PBS, 2 independent litters for MIA).
b, Schematic representation of the regulation of translation initiation through eIF2α -dependent regulation and mTOR-dependent regulation.
c, Immunoblot analysis measuring phospho-eIF2α and phospho-PERK levels and quantification for phospho-eIF2α in E18.5 PBS and MIA fetal cortices. Y-axis represents relative blot intensity to PBS male control (Two-way ANOVA sex (male or female) × stimulus (PBS or MIA) interaction F1,22 = 8.229, P = 0.0089; effect of sex F1,22 = 3.939, P = 0.0598; effect of stimulus F1,22 = 7.567, P = 0.0117 followed by Tukey multiple comparisons test: PBS male versus MIA male ***P = 0.0009, PBS female versus MIA male *P = 0.0118, MIA male versus MIA female **P = 0.0097; n = 7 for PBS male, n = 9 for MIA male, n = 5 for PBS female and MIA female pups; 3 independent litters).
d, Immunoblot analysis measuring phospho-eIF2α and phospho-PERK levels and quantification for phospho-eIF2α in isotype antibody or IL-17a-blocking antibody-treated E18.5 PBS and MIA fetal cortices. Y-axis represents relative blot intensity to the isotype antibody-treated PBS control (phospho-eIF2α: one-way ANOVA, F2,23 = 14.88, P = 7.14 x 10⁻⁵, Tukey’s multiple comparisons test: PBS isotype ab versus MIA isotype ab ****P = 5.58 x 10⁻⁵, MIA isotype ab versus MIA anti-IL-17a **P = 0.0083; phospho-PERK: one-way ANOVA, F2,23 = 7.259, P = 0.0036, Tukey’s multiple comparisons test: PBS isotype ab versus MIA isotype ab **P = 0.0036, MIA isotype ab versus MIA anti-IL-17a *P = 0.0423; n = 8 for PBS isotype ab and MIA anti-IL-17a, n = 10 for MIA isotype ab; 3 independent litters).
Data are mean ± SEM; see Supplementary Table 20 for detailed statistics. Unprocessed blots are provided as a Source Data file.

