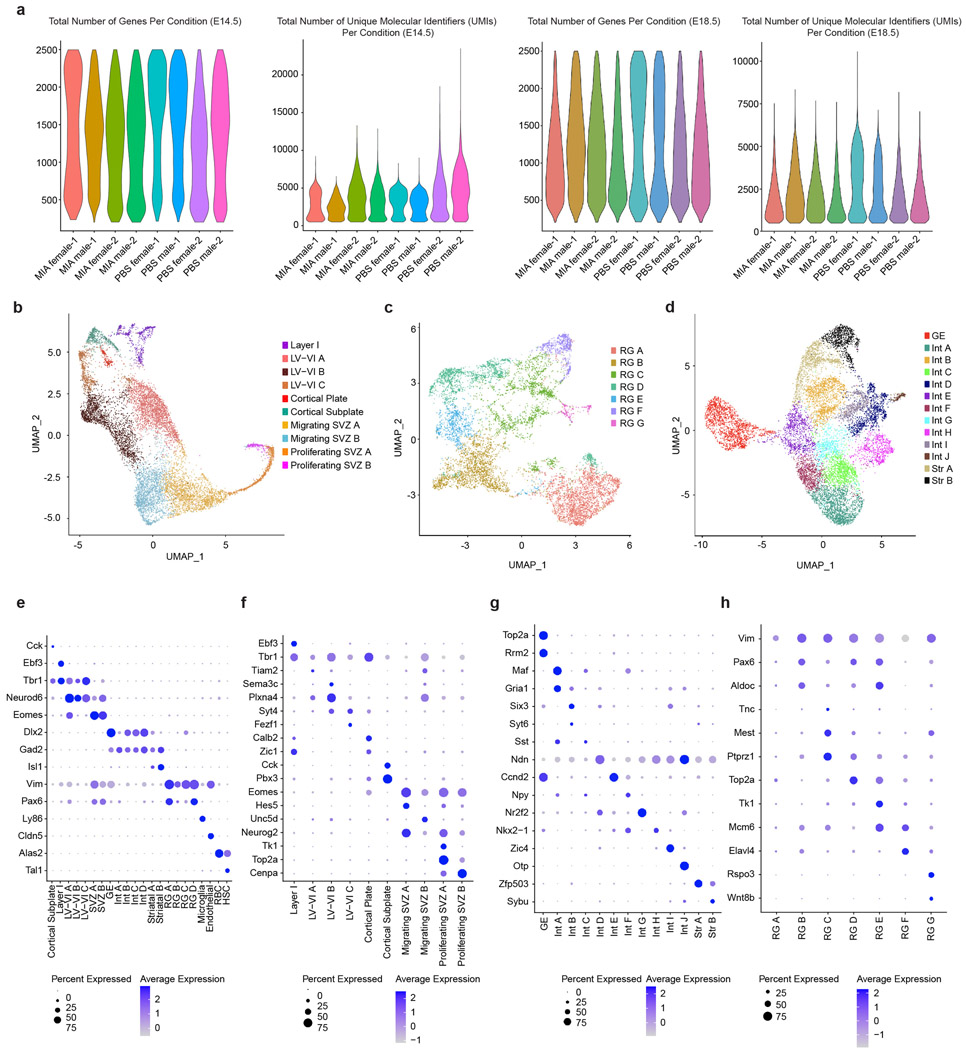
Extended Data Fig. 1. Quality Control and E14.5 Sub-clustering.
a, Total number of genes per condition and total number of unique molecular identifiers (UMIs) per condition in the final E14.5 and E18.5 single cell sequencing datasets. Data from n = 2 mice per group.
b, UMAP of sub-clustering of mature and immature (SVZ, cortical plate, cortical subplate) neurons at E14.5. Data from n = 2 mice per group.
c, UMAP of sub-clustering of radial glia (RG) at E14.5. Data from n = 2 mice per group.
d, UMAP of sub-clustering of interneurons (Int), ganglionic eminence (GE), and striatal neurons at E14.5. Data from n = 2 mice per group.
e, Dot plot of marker genes associated with all cells at E14.5. Data from n = 2 mice per group.
f, Dot plot of marker genes associated with the cells in (b): mature and immature (SVZ, cortical plate, cortical subplate) neurons at E14.5. Data from n = 2 mice per group.
g, Dot plot of marker genes associated with the cells in (d): interneurons (Int), ganglionic eminence (GE), and striatal neurons at E14.5. Data from n = 2 mice per group.
h, Dot plot of marker genes associated with the cells in (c): radial glia (RG) at E14.5. Data from n = 2 mice per group.

