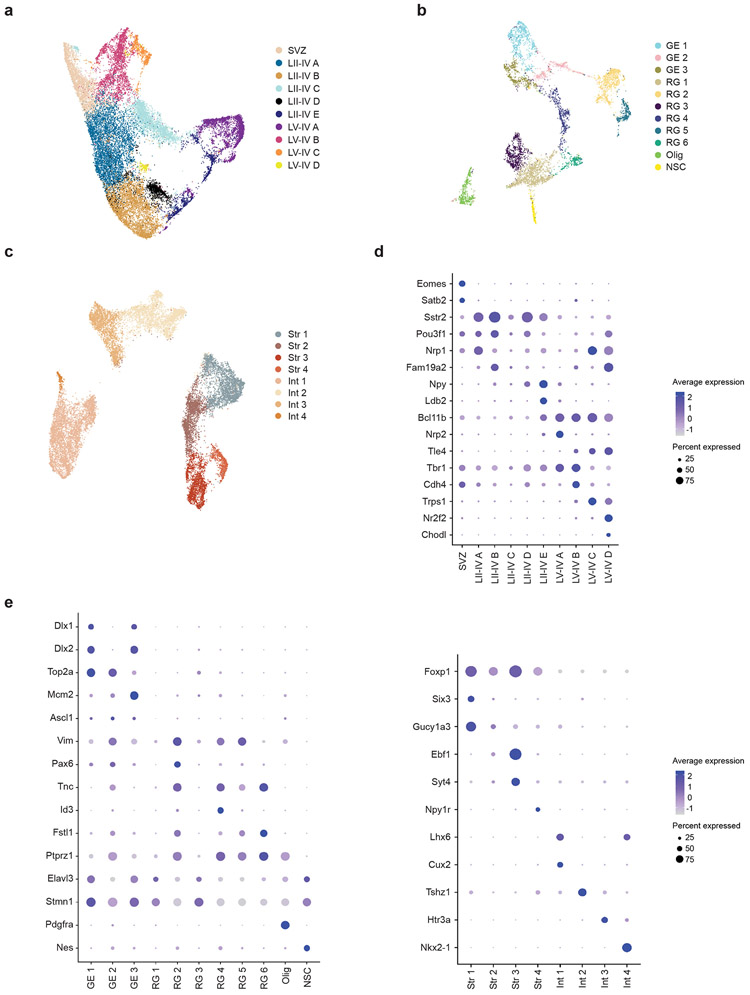
Extended Data Fig. 2. E18.5 sub-clustering.
a, UMAP of sub-clustering of mature and immature (SVZ) neurons at E18.5. Data from n = 2 mice per group.
b, UMAP of sub-clustering of radial glia (RG), ganglionic eminence (GE), oligodendrocytes (Olig), and neural stem cells (NSC) at E18.5. Data from n = 2 mice per group.
c, UMAP of sub-clustering of striatal neurons (Str) and interneurons (Int) at E18.5. Data from n = 2 mice per group.
d, Dot plot of marker genes associated with cells in (a): mature and immature (SVZ) neurons at E18.5. Data from n = 2 mice per group.
e, (left) Dot plot of marker genes associated with cells in (b): radial glia (RG), ganglionic eminence (GE), oligodendrocytes (Olig), and neural stem cells (NSC) at E18.5; and (right) Dot plot of marker genes associated with cells in (c): striatal neurons (Str) and interneurons (Int) at E18.5. Data from n = 2 mice per group.

