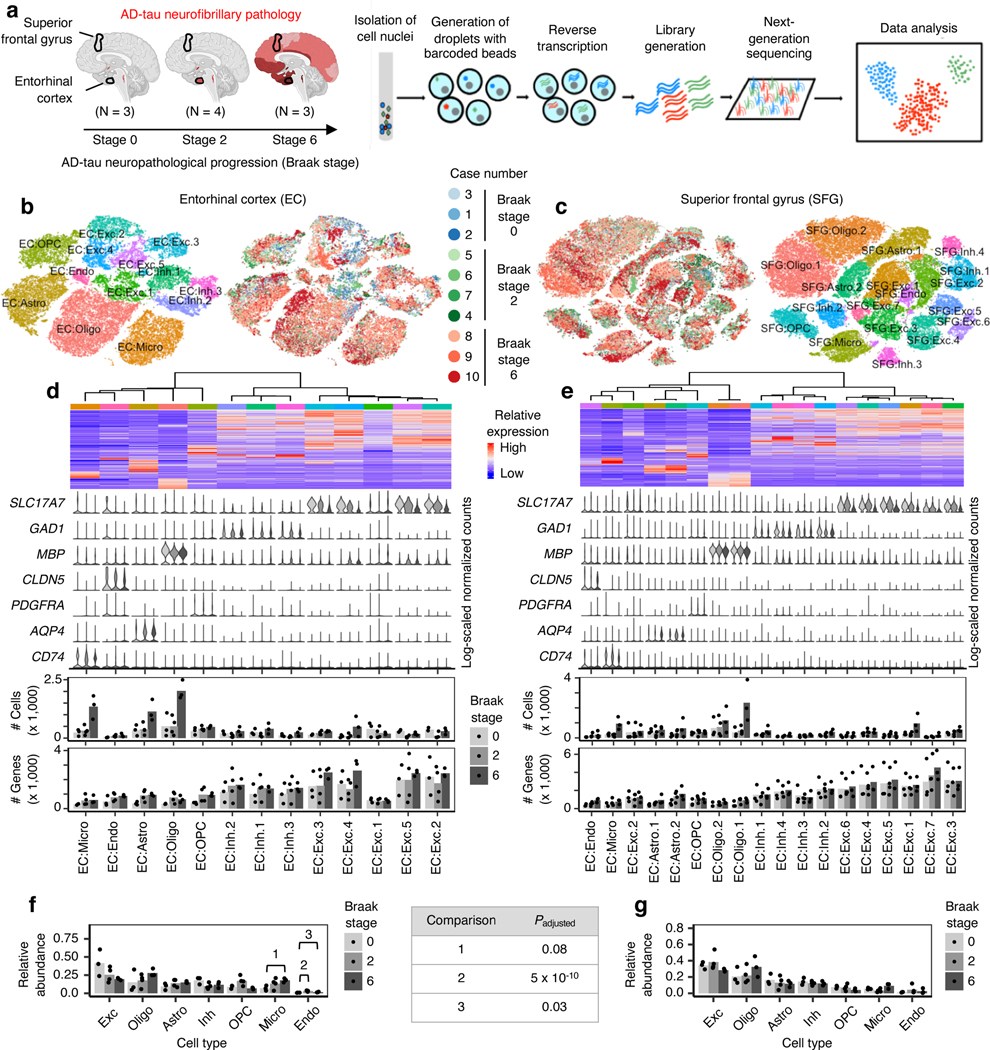
Fig. 1 |. AD progression differentially affects the cell-type composition of the EC and SFG.
a, Schematic of experimental design and sample processing. Darker shades of red in brain cartoons reflect more severe AD-tau neurofibrillary pathology. b-c, tSNE projection of cells from the EC (b) and SFG (c) in their respective alignment spaces, colored by individual of origin (center) or cluster assignment (outer). d-e, Heatmap and hierarchical clustering of clusters and cluster marker expression (top subpanel); “High” and “Low” relative expression reflect above- and below-average expression, respectively (see Methods). Expression of cell type markers in each cluster (second subpanel). The average number of cells and average number of genes detected per cell in each cluster (third and fourth subpanels). f-g, Relative abundance of major cell types across Braak stages. For each brain region, statistical significance of differences in relative abundance across Braak stages (Braak 0 n=3, Braak 2 n=4, Braak 6 n=3, where n is the number of individuals sampled) was determined by beta regression and adjusted for multiple comparisons (see Methods). Cell type abbreviations: Exc – excitatory neurons, Oligo – oligodendrocytes, Astro – astrocytes, Inh – inhibitory neurons, OPC – oligodendrocyte precursor cells, Micro – microglia, Endo – endothelial cells.

