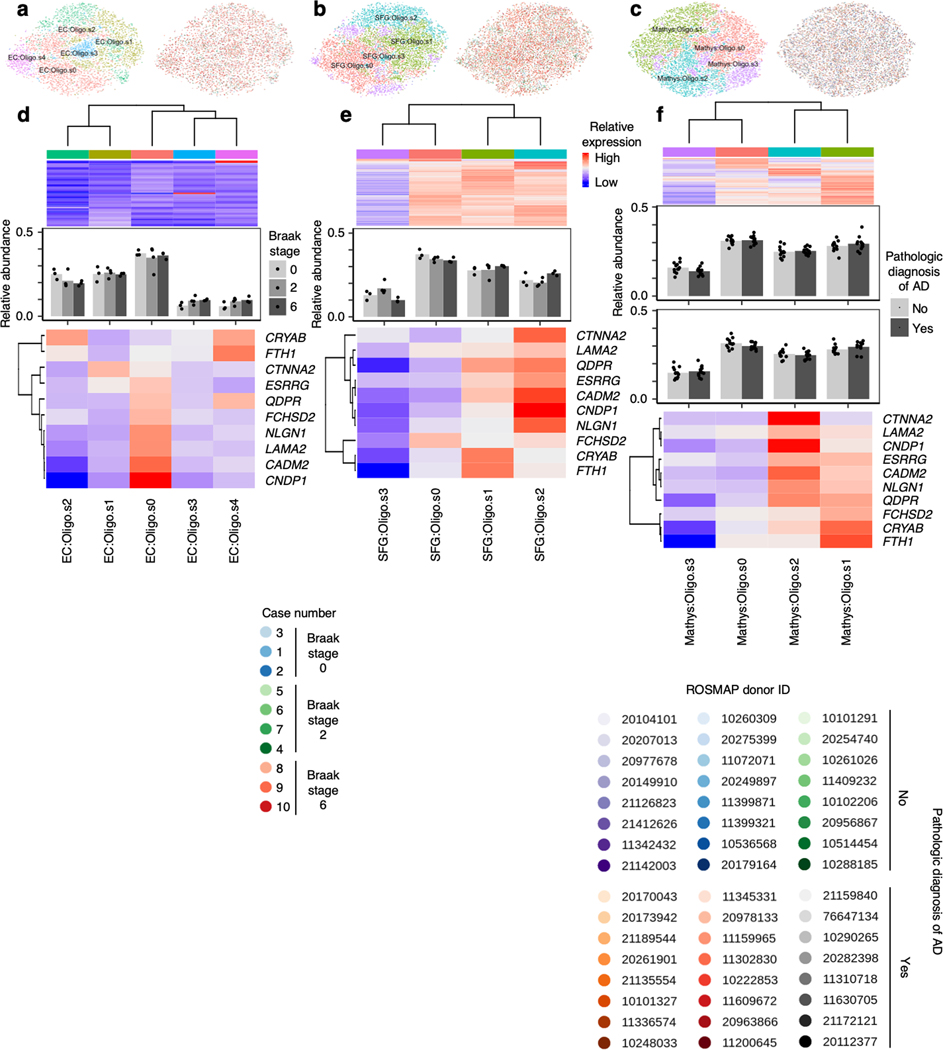
Extended Data Fig. 9. Subclustering of oligodendrocytes identifies subpopulations with higher expression of AD-associated oligodendrocyte markers from Mathys et al.
a-c, tSNE projection of oligodendrocytes from the EC (a), SFG (b), and Mathys et al.14 (c) in their respective alignment spaces, colored by subpopulation identity (left) or individual of origin (right). d-f, Heatmap and hierarchical clustering of subpopulations and subpopulation marker expression (top subpanels); “High” and “Low” relative expression reflect above- and below-average expression, respectively (see Methods). Relative abundance of subpopulations (middle subpanels) across Braak stages in the EC and SFG (for each brain region, Braak 0 n=3, Braak 2 n=4, Braak 6 n=3, where n is the number of individuals sampled) or between AD cases vs. controls in Mathys et al.14 (for each sex, cases n =12, controls n = 12, where n is the number of individuals sampled); statistical significance of differences in relative abundance was determined by beta regression and adjusted for multiple comparisons (see Methods). Relative expression of AD-associated oligodendrocyte subpopulation markers from Mathys et al.14 (bottom subpanels).

