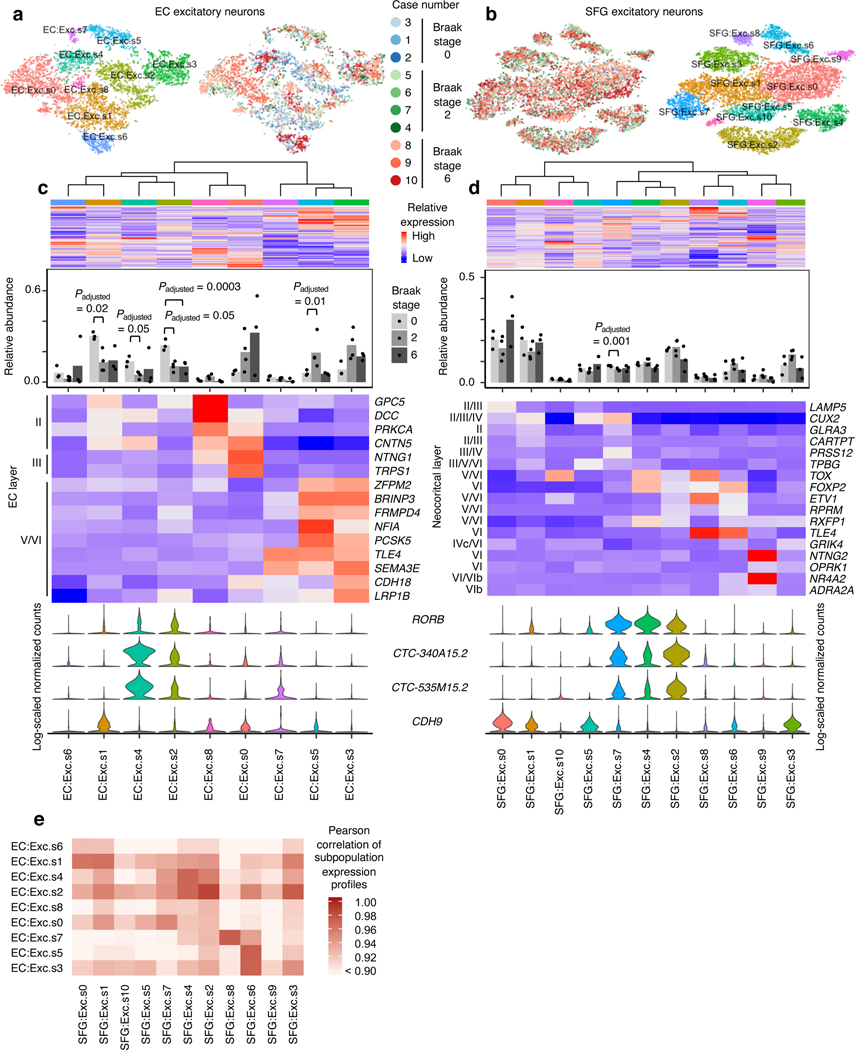
Fig. 2 |. RORB-expressing excitatory neuron subpopulations in the EC are selectively vulnerable.
a-b, tSNE projection of excitatory neurons from the EC (a) and SFG (b) in their respective alignment spaces, colored by individual of origin (center) or subpopulation identity (outer). c-d, Heatmap and hierarchical clustering of subpopulations and subpopulation marker expression (top subpanel); “High” and “Low” relative expression reflect above- and below-average expression, respectively (see Methods). Relative abundance of subpopulations across Braak stages (second subpanel); for each brain region, statistical significance of differences in relative abundance across Braak stages (Braak 0 n=3, Braak 2 n=4, Braak 6 n=3, where n is the number of individuals sampled) was determined by beta regression and adjusted for multiple comparisons (see Methods). Expression heatmap of EC layer-specific genes identified from Ramsden et al.22 (c, third subpanel). Expression heatmap of neocortical layer-specific genes from Lake et al.12 (d, third subpanel). Expression of selectively vulnerable subpopulation markers identified in the EC (bottom subpanel). e, Heatmap of Pearson correlation between the gene expression profiles of EC and SFG subpopulations.

