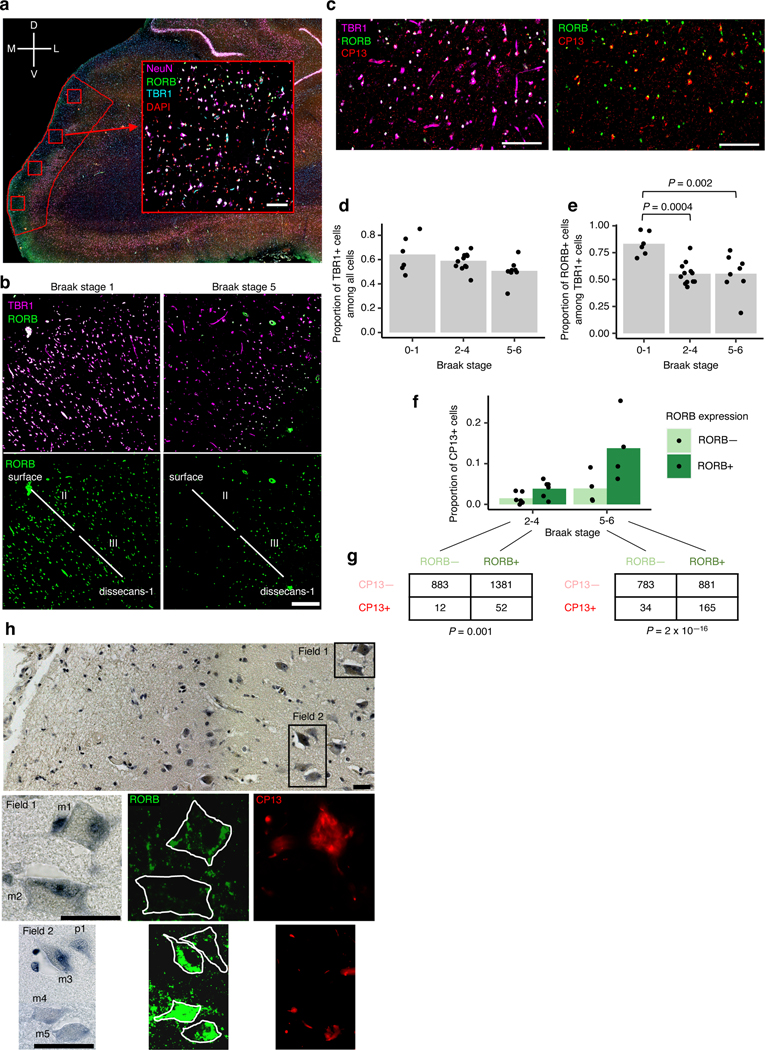
Fig. 3 |. Immunofluorescence of the EC validates selective vulnerability of RORB-expressing excitatory neurons.
a, The method for extracting regions of interest (ROI) is illustrated using a representative brain slice used for immunofluorescence (pseudo-colored: DAPI in blue, RORB in green, TBR1 In orange and NeuN in pink) with the EC delineated in red. Four ROIs (drawn in red squares) were randomly distributed along the superficial layers of the EC and extracted for quantification after masking neurons (see Methods). A representative ROI image is shown as insert (note that the pseudo-coloring scheme for the insert, as indicated in the Figure, differs from the pseudo-coloring scheme of the larger panel). The anatomical orientation of the slice is provided in the top left corner (D – dorsal, V – ventral, M – medial, L – lateral). b, Representative RORB staining in a Braak stage 1 sample (left) vs. a Braak stage 5 sample (right), shown with (top) and without (bottom) excitatory neurons marked by TBR1 staining. The EC layers captured in the image are demarcated in the bottom subpanels (see Methods and Extended Data Fig. 6). c, Representative CP13 staining in a Braak stage 6 sample, shown together with TBR1 and RORB staining (left) or only with RORB staining (right). d-e, Proportion of TBR1+ cells among all cells (d) or proportion of RORB+ cells among TBR1+ cells (e) averaged across ROIs for each individual across groups of Braak stages; statistical significance of differences in the above proportions across groups of Braak stages (Braak 0–1 n=6, Braak 2–4 n=12, Braak 5–6 n=8, where n is the number of individuals sampled) was determined by beta regression without adjustment for multiple comparisons. f, Proportion of CP13+ cells in RORB- or RORB+ excitatory neurons (i.e. TBR1+ cells) averaged across ROIs for each individual across groups of Braak stages. g, Contingency tables of raw counts of TBR1+ cells based on their RORB or CP13 staining status summed across ROIs and individuals for each group of Braak stages (Braak 2–4 n=6, Braak 5–6 n=4, where n is the number of individuals sampled); the Fisher’s Exact Test p-value (two-sided) is shown below each table. h, Representative image of EC layer II neurons stained with gallocyanin (top subpanel) with the corresponding RORB and CP13 immunofluorescence signal shown in selected fields (Field 1 – middle subpanels, Field 2 – bottom subpanels). RORB+ neurons include both large multipolar neurons (m1, m3, m4, m5) and pyramidal neurons (p1). One large multipolar neuron (m2) is RORB-. The neuronal somas are outlined manually in white in the RORB immunofluorescence images to aid interpretation. Scale bars shown in a-c correspond to 100 microns; scale bars shown in h correspond to 15 microns. For all data shown in this figure, the experiment was performed once.

