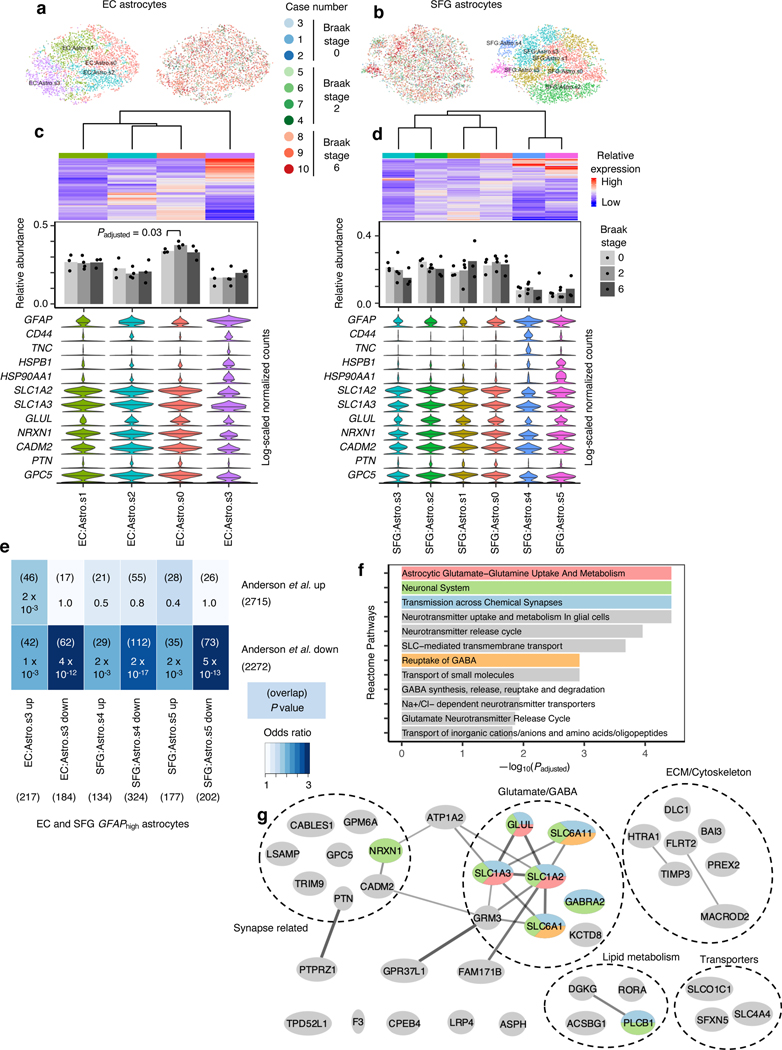
Fig. 5 |. GFAPhigh astrocytes show signs of dysfunction in glutamate homeostasis and synaptic support.
a-b, tSNE projection of astrocytes from the EC (a) and SFG (b) in their respective alignment spaces, colored by individual of origin (center) or subpopulation identity (outer). c-d, Heatmap and hierarchical clustering of subpopulations and subpopulation marker expression (top subpanel); “High” and “Low” relative expression reflect above- and below-average expression, respectively (see Methods). ). Relative abundance of subpopulations across Braak stages (middle subpanel); for each brain region, statistical significance of differences in relative abundance across Braak stages (Braak 0 n=3, Braak 2 n=4, Braak 6 n=3, where n is the number of individuals sampled) was determined by beta regression and adjusted for multiple comparisons (see Methods). Expression of genes associated with reactive astrocytes, with median expression level marked by line (bottom subpanel). e, Enrichment analysis of overlap between differentially expressed genes in GFAPhigh astrocytes vs. differentially expressed genes in reactive astrocytes from Anderson et al.40 The number of genes in each gene set and the number of overlapping genes are shown in parentheses, and the hypergeometric test p-values (one-sided, corrected for multiple testing using the Benjamini-Hochberg procedure) are shown without parentheses. f, Enrichment of Reactome pathways in downregulated genes in GFAPhigh astrocytes, with selected terms highlighted in color. g, Functional association network (see Methods) of downregulated genes shared between EC and SFG GFAPhigh astrocytes that overlap with those in Anderson et al.40 Genes with stronger associations are connected by thicker lines. Genes that belong to selected gene sets in f are highlighted in color.

