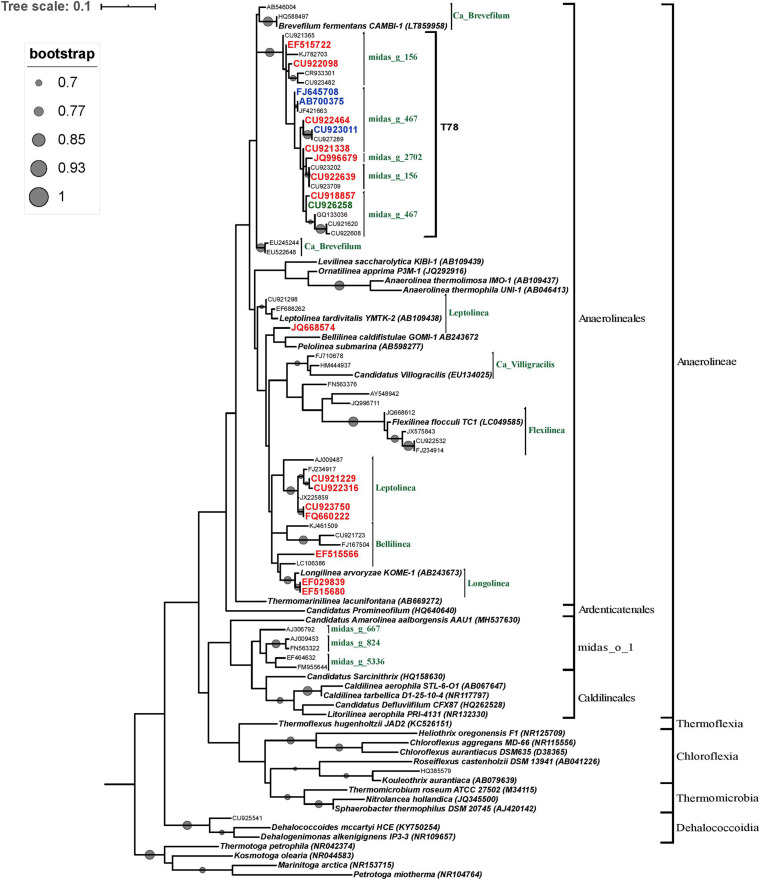
FIGURE 6.
Phylogenetic tree of the phylum Chloroflexi inferred from the 16S rRNA gene sequences. The tree was reconstructed using the ML method and the GTR model. ML bootstrap values greater than or equal to 70% are shown at each node. Bar, 0.01 substitutions per site. The reference OTUs with a relative abundance greater than 5% in at least one reactor are represented by their GenBank accession numbers. Only OTUs from the core microbiome are indicated in color: from STARs are in blue color, from WTARs are in red color. Thermotoga spp. sequence served as an outgroup for rooting tree.

