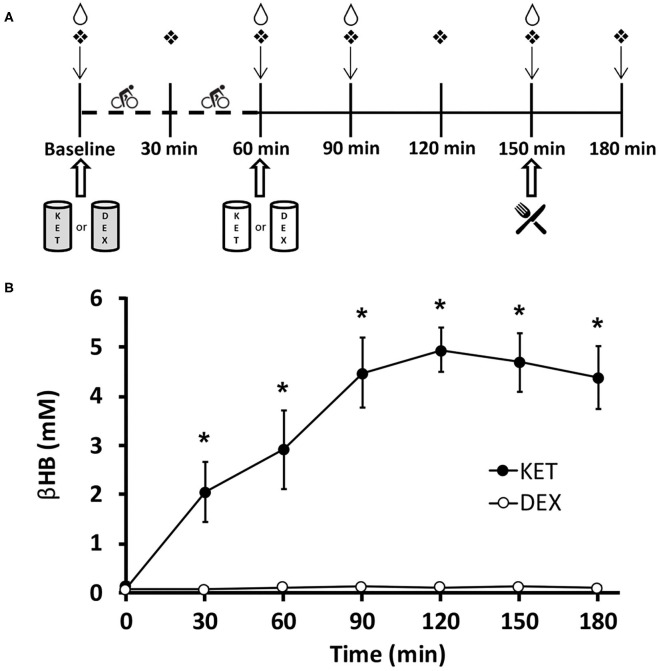
Figure 1.
(A) Timeline of experimental conditions. Participants arrived at the laboratory in the morning (0800–0900 h) in a fasted state (>10 h). ↓Appetite visual analog scale;  finger capillary draw;
  venipuncture;
  ad libitum meal;
  0.5 g·kg−1 KET or isocaloric DEX;
  0.25 g·kg−1 KET or isocaloric DEX. Dashed timeline represents 1 h of exercise cycling at 70% VO2peak. (B) Blood d-β-hydroxybutyrate levels in participants for both KET and DEX drink conditions. Values are means ± SD, n = 13. *P < 0.05 between KET and DEX conditions. βHB, d-β-hydroxybutyrate; DEX, dextrose; KET, ketone monoester.

