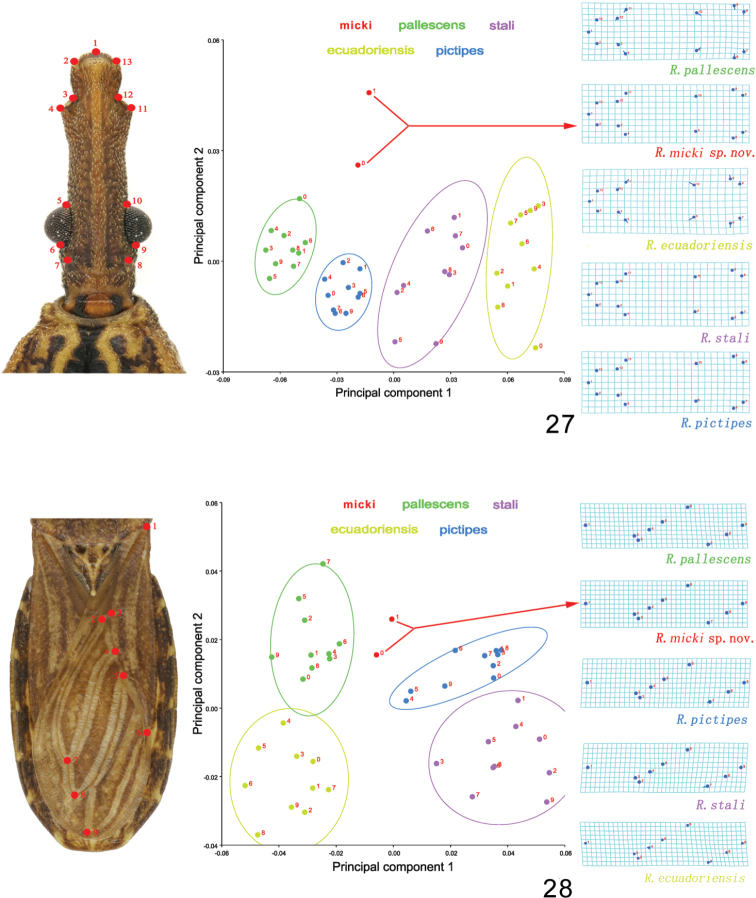
Figures 27, 28.
Morphological variations of five Rhodnius species based on Principal Component Analysis. The 90% equal frequency ellipses containing approximately 90% of the data points are shown. The thin-plate splines show the average shape for each species, corresponding to the deformation of the landmarks compared with the origin (the average shape of all species) 27 head 28 fore wing.

