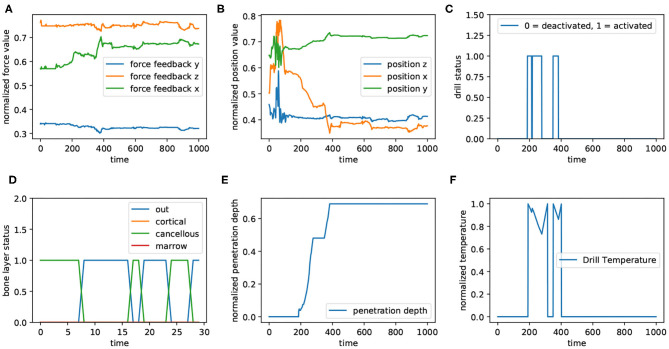
Figure 8.
The diagram shows the data captured from different sources in a window of 1,000 data samples. Panels (A,B) show the force feedback and positions, receptively. They have been plotted in 3 dimension (x, y, and z). In addition, all values corresponding to force feedback, positions, drill's temperature (F), and penetration depth (E) have been normalized (between 0 and 1). Also, for both drilling status (C) and bone's layers (D), 0 denotes “inactivated” and 1 means “activated.” Panel (D) illustrates the layer of the bone, in which drill is located. For a better visualization in this subplot, the 30 first data corresponding to the aforementioned window are plotted.

