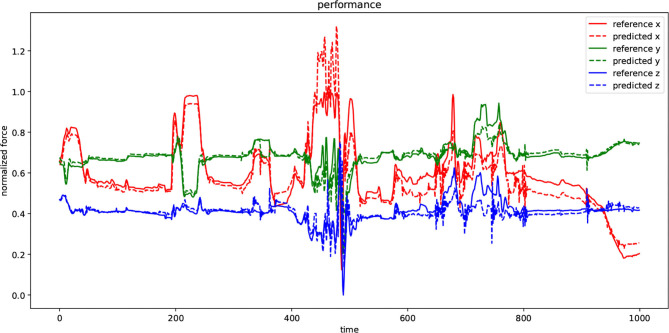
Figure 9.
The diagram depicts the performance of the DHG in a specified window with 1,000 data samples. Every dimension of force-feedback signals (x, y, and z) has a reference and a predicted demonstration. The value of the references has been normalized and also the model has been trained by normalized training set as well. The DHG makes predictions on force feedback in every time t using 20 previous data samples.

