
Figure 10.
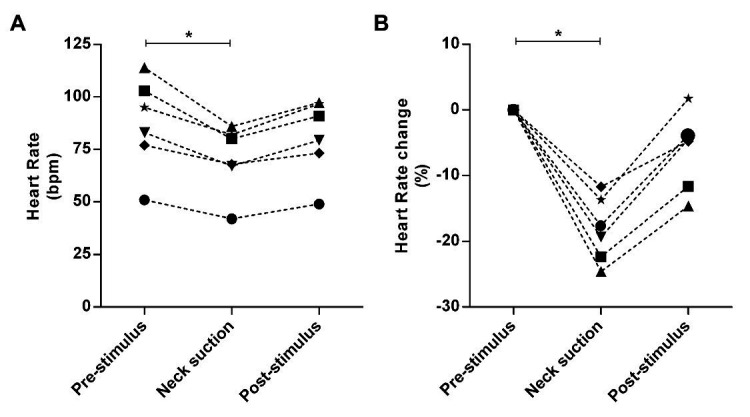
Absolute and relative responses are shown in panels A, and B, respectively. The responses were calculated through the lowest value (nadir) obtained during neck suction and the respective pre-stimulus baseline, i.e., 3-bpm average immediately preceding neck suction. *p < 0.01.