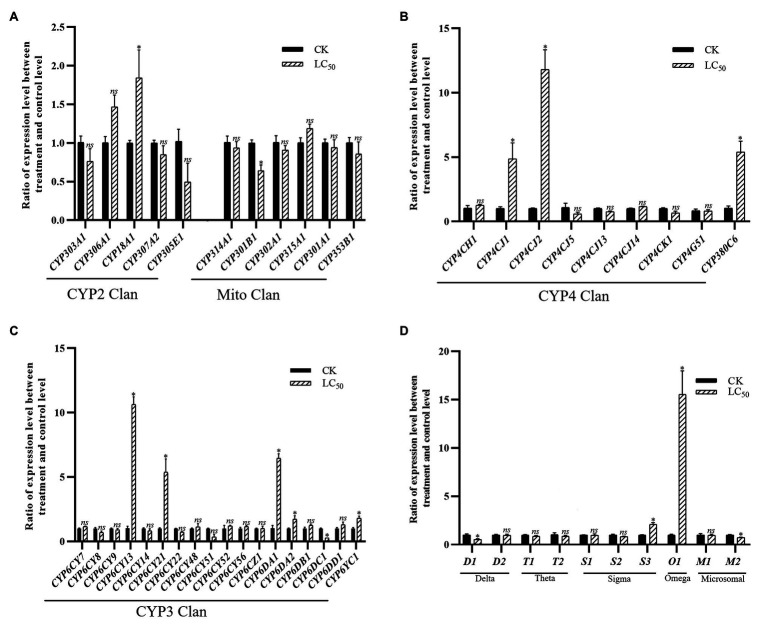
Figure 4.
Fold changes in the expression of 38 P450 genes and 10 GST genes in the A. craccivora susceptible strain after the LC50 dose of imidacloprid treatment. The significant differences were marked by asterisks. *Significantly at 0.05 level. The ns represents no significant difference. (A) Fold changes in the expression of P450 genes from CYP2 and Mito Clan. (B) Fold changes in the expression of P450 genes from CYP4 Clan. (C) Fold changes in the expression of P450 genes from CYP3 Clan. (D) Fold changes in the expression of GST genes.

