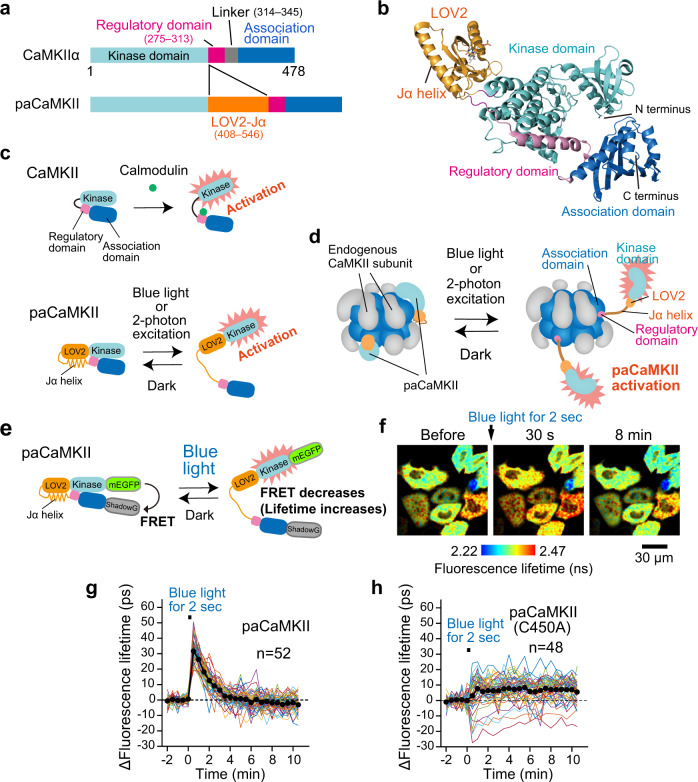
Fig. 1. Development of paCaMKII.
a CaMKIIα and paCaMKII domain structures. b Structural model of paCaMKII, visualized with PyMOL. The LOV2, kinase, regulatory, and association domains are shown as yellow-, cyan-, magenta-, blue-colored cartoons, respectively. Note that this structure is putative, and was created by available structural data (PDB: #3SOA and 2V1B)34,35. c Schematic drawing of endogenous and paCaMKII activation. d Schematic drawing of paCaMKII activation in the oligomeric state. Note that most CaMKII and paCaMKII likely exist in oligomeric form in cells. e A schematic of the conformational change of the paCaMKII FRET construct. mEGFP and ShadowG66 were fused to the N- and C-terminus, respectively. Blue light illumination induces the structural change of paCaMKII (i.e., the distance between mEGFP and ShadowG becomes longer), leading to decreased FRET and increased mEGFP fluorescence lifetime. f Representative fluorescence lifetime images of mEGFP-paCaMKII-ShadowG after blue LED light illumination for 2 s at 35 mW cm−2. For imaging, two-photon excitation at 920 nm was used to excite mEGFP. The lifetime change (conformational change) of mEGFP-paCaMKII-ShadowG (g) and its light-insensitive mutant (C450A) (h) in individual HeLa cells after blue light illumination. Colored lines represent the response signal from individual cells, and the black circles indicate the average time course. The data are presented as mean ± SEM. The number of samples (n) is indicated in the respective panels. Source data are provided as a Source Data file.

