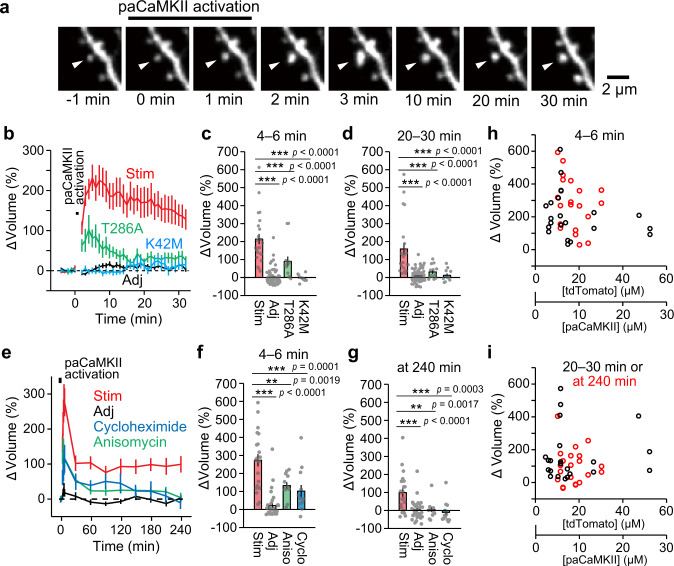
Fig. 3. paCaMKII activation triggers structural plasticity.
a Two-photon fluorescence images of dendritic spines during the induction of sLTP by two-photon paCaMKII activation. A hippocampal CA1 neuron expressing tdTomato-P2A-paCaMKII was observed by two-photon excitation at 1000 nm, and paCaMKII was activated at 900 nm in a spine indicated by white arrows. b Averaged time courses of spine volume change in the stimulated spine (Stim) and adjacent spines (2–10 µm, Adj). Data using paCaMKII mutants (T286A and K42M) are also shown. n(spines/neurons) = 23/11 stimulated spines, 67/11 adjacent spines, 13/6 T286A, and 11/5 K42M. Quantification of transient (c, averaged over 4–6 min) and sustained (d, averaged over 20–30 min) spine volume change. n(spines/neurons) is the same as in b. e Averaged time courses of long-term observation of spine volume change of the stimulated spine (Stim) and adjacent spines (Adj). Data using protein synthesis inhibitors (50 µM cycloheximide and 50 µM anisomycin) are also shown. n(spines/neurons) = 21/8 stimulated spines, 33/8 adjacent spines, 12/4 cycloheximide, and 12/4 anisomycin. Quantification of transient (f, averaged over 4–6 min) and sustained spine volume change (g, at 240 min). n(spines/neurons) is the same as in e. h, i The dependency of the paCaMKII expression level on spine enlargement following two-photon excitation. The data points of Stim used in c and f were replotted against tdTomato and paCaMKII concentration with black and red circles in h, respectively. The data points of Stim used in d and g were replotted with black and red circles in i, respectively. The tdTomato expression was measured by comparing the fluorescence intensity of tdTomato in proximal dendrites and a known concentration of purified tdTomato under a two-photon microscope. Because the ratio of tdTomato and paCaMKII expression is 2:1 (see Supplementary Fig. 4), the scale for paCaMKII concentration is presented as well. For b–g, the data are presented as mean ± SEM. Statistical comparisons were performed using one-way ANOVA followed by Dunnett’s post-hoc test. ***p < 0.001; **p < 0.01; *p < 0.05; N.S. not significant. Source data are provided as a Source Data file.

