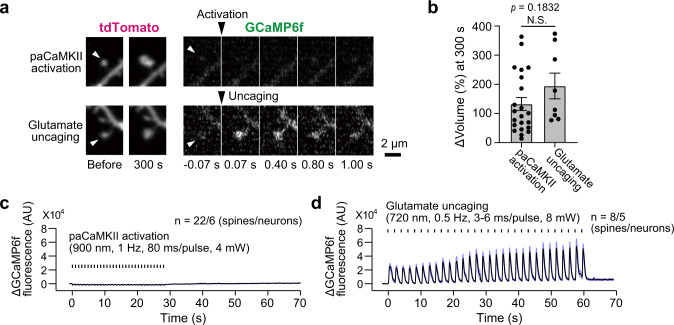
Fig. 4. Calcium imaging during glutamate uncaging and paCaMKII activation.
a Images of dendritic spines of a neuron expressing Ca2+ indicator GCaMP6f and tdTomato-P2A-paCaMKII. Both GCaMP6f and tdTomato were simultaneously imaged by two-photon excitation at 1000 nm. paCaMKII activation at 900 nm (top) or glutamate uncaging at 720 nm (bottom) was used to stimulate the spine, respectively. Images were slightly noisy because they were acquired at a high temporal resolution (15.6 Hz). GCaMP6f and tdTomato images were averaged over 3 and 30 frames, respectively. Arrowheads indicate the stimulated spines. b Quantification of spine volume change at 300 s. n(spines/neurons) = 22/6-paCaMKII activation, 8/5 glutamate uncaging. The data are presented as mean ± SEM; N.S. not significant, represents p > 0.05; two-tailed unpaired t test. Ca2+ transients in the stimulated spine by paCaMKII uncaging (c) or glutamate uncaging (d). The traces were averaged by three frames moving average. The number of samples is the same in b, and also indicated in the figures. Source data are provided as a Source Data file.

