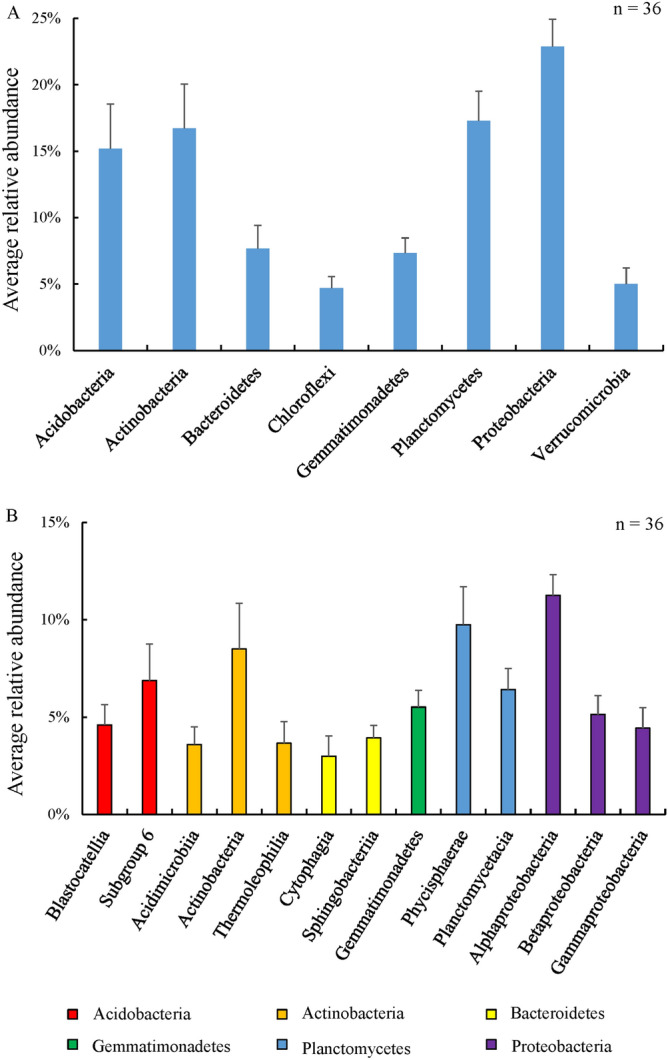
Figure 2.

Average relative abundance of prokaryotic taxa in samples collected from rhizosphere soil at each developmental stage of Potentilla anserina. Average relative abundance was estimated for each prokaryotic taxon by dividing the total relative abundance across all samples by the number of samples (n = 36). The error bars show the standard deviation (calculation across 36 samples) for each average value. (A) Prokaryotic phyla with average relative abundance > 1% and (B) prokaryotic classes with average relative abundance > 1%.
