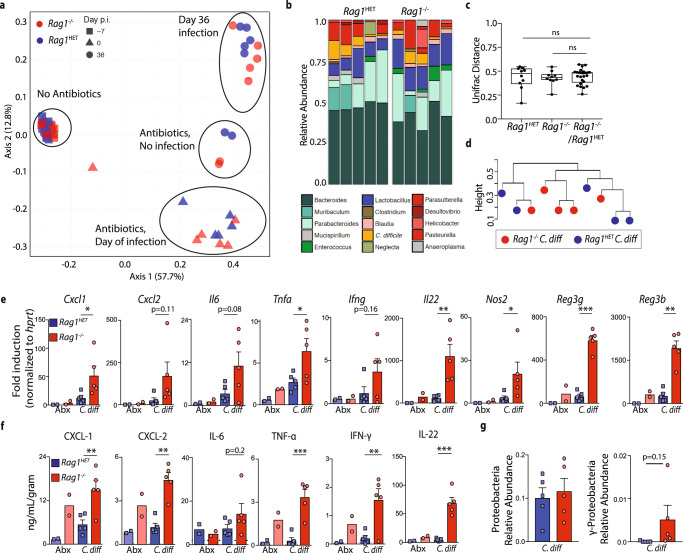
Fig. 2. C. difficile-infected Rag1−/− and Rag1HET mice exhibit enhanced induction of proinflammatory immune response genes.
a Unweighted UniFrac principal coordinate analysis plot of 16S bacterial rRNA ASVs from fecal pellets of Rag1−/− and Rag1HET mice prior to ABX treatment, at day 0 of infection, and at day 36 post-C. difficile infection or ABX-treatment alone. Ellipses signify different experimental groups. b Relative abundance of top 15 bacterial ASVs from C. difficile-infected of Rag1−/− and Rag1HET mice at day 36 p.i. Bar plot is displayed at the genus level except for orange bars that represent an ASV aligning to C. difficile. c Unweighted UniFrac distance comparing the microbiota beta diversity dissimilarity within and between C. difficile-infected Rag1−/− and Rag1HET groups at day 36 p.i. One-way ANOVA conducted for statistical comparison. Boxes represent median, first and third quartile. Whiskers extend to the highest and lowest data point. d Dendrogram representation of intestinal microbial communities of C. difficile-infected of Rag1−/− and Rag1HET mice at day 36 p.i. using unsupervised hierarchical clustering of unweighted UniFrac distances to identify similarities between samples. e mRNA expression of proinflammatory immune response genes in whole colon tissue as assessed by qRT-PCR. Gene expression relative to ABX-treated Rag1HET mice and normalized to Hprt. Statistical significance was calculated by a two-sided unpaired t-test. *p < 0.05, **p < 0.01. Data are presented as mean values ± SEM. f Proinflammatory cytokine and chemokine protein levels in cecal tissue homogenates. Statistical significance was calculated by a two-sided unpaired t-test. *p < 0.05, **p < 0.01, ***p < 0.001. Data are presented as mean values ± SEM. g Relative abundance of Proteobacteria and gamma-Proteobacteria ASVs in fecal pellets of Rag1−/− and Rag1HET mice at day 36 p.i. Statistical significance was calculated by a two-sided unpaired t test. Data are presented as mean values ± SEM. Data presented in figure are representative of three independent experiments. Prior to ABX treatment (n = 10 Rag1−/−; n = 12 Rag1HET mice), day 0 of infection (n = 6 Rag1−/−; n = 5 Rag1HET mice), day 36 post-C. difficile (n = 5 Rag1−/− and Rag1HET mice) or ABX-treatment alone (n = 2 Rag1−/− and Rag1HET mice).

