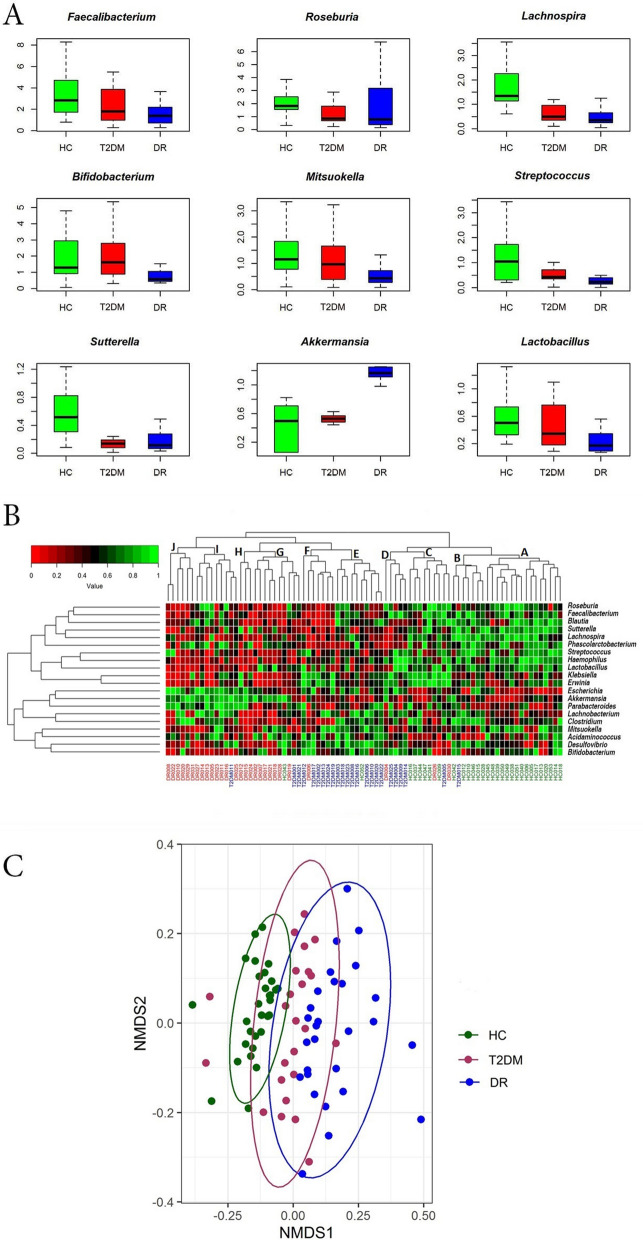
Figure 2.
Gut microbiomes differ significantly across (HC, n = 30), Type 2 Diabetes mellitus (T2DM, n = 24) and Diabetic Retinopathy (DR, n = 28) individuals. (A) Bacterial genera exhibiting significant (Kruskal Wallis test, BH corrected p < 0.05) differential abundance in the gut microbiomes from HC, T2DM and DR individuals. Differentially abundant genera having a median abundance of > 0.5% in at least one group of samples have been depicted. Median abundances (horizontal line) and interquartile ranges have been indicated in the plots. (B) Two dimensional heat map showing rank normalized abundances determined by Kruskal Wallis test (scaled between 0 and 1) of 20 differentially abundant bacterial genera in gut microbiomes from HC, T2DM and DR individuals. The discriminating genera have been arranged along the two dimensions (axes) based on hierarchical clustering. (C) Beta diversity analysis using NMDS plots based on Bray–Curtis dissimilarity of bacterial OTUs in the gut microbiomes of HC, T2DM and DR. The bacterial community appeared to vary significantly across HC, T2DM and DR (PERMANOVA, p = 0.001). Figures were generated using R software version 3.4.3. R: A language and environment for statistical computing (http://www.R-project.org/). Packages matrixStats v.0.55.0 (https://cran.r-project.org/web/packages/matrixStats/index.html) and gplots v. 3.0.4 (https://cran.r-project.org/web/packages/gplots/index.html) were used to generate the heatmap in Fig. 2B. Packages ggplot2 v.3.2.1 (https://cran.r-project.org/web/packages/ggplot2/index.html), vegan v.2.5-6 (https://cran.r-project.org/web/packages/vegan/index.html) and rgl v. 0.100.54 (https://cran.r-project.org/web/packages/rgl/index.html) were used to generate the NMDS plot in Fig. 2C.

