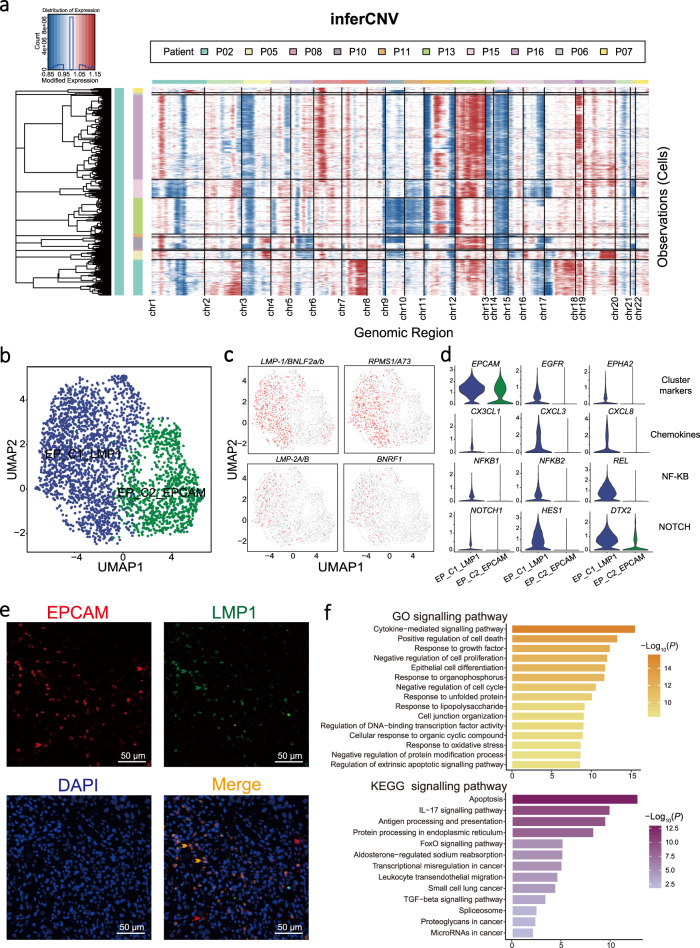
Fig. 5. Heterogeneity of malignant cells with distinct EBV infection in tumour tissues.
a Heatmap showed the large-scale CNVs for epithelial cells (rows along y-axis) from 10 NPC tumours. CNVs were inferred according to the average expression of 100 genes spanning each chromosomal position (x-axis). Red: gains; blue: losses. Malignant NPC cells from different patients and the range of different chromosomes are indicated as different colour bars on the left and top to the heatmap, respectively. b UMAP plot of 2,787 malignant cells grouped into two cell clusters (EP_C1_LAMP1 and EP_C2_EPCAM). Each dot represents a cell, coloured according to a cell cluster. c UMAP plots showed the expression of EBV-encoded genes (LMP-1/BNLF2a/b, RPMS1/A73, LMP-2A/B, and BNRF1) in malignant cells. Each dot represents a single cell, and the depth of colour from grey to red represents low to high expression. d Violin plots showed the normalised expression of cluster markers, chemokines, and genes associated with NF-κB and Notch pathways in each cluster. In each plot, cell clusters and the expression level of a gene as the chart tile are indicated at the x- and y-axis, respectively. e Representative images of multiplex immunofluorescence staining of malignant cells in NPC tissues. Proteins detected using respective antibodies in the assays are indicated on top. The red, green, and orange arrows indicated the representative cells positive for EPCAM, LMP1, and co-expression of EPCAM and LMP1 proteins in malignant cells, respectively. Images are representative of three biological replicates. Scale bars, 50 µm. f Bar plots showed the selected signalling pathways with significant enrichment of GO (top panel) and KEGG (bottom panel) terms for EBV+ malignant cells (EP_C1_LMP1) compared to EBV- malignant cells (EP_C2_EPCAM), coloured from light to dark according to their −log10(P-values) from low to high. P-values were calculated by one-sided hypergeometric test and adjusted for multiple comparisons.

