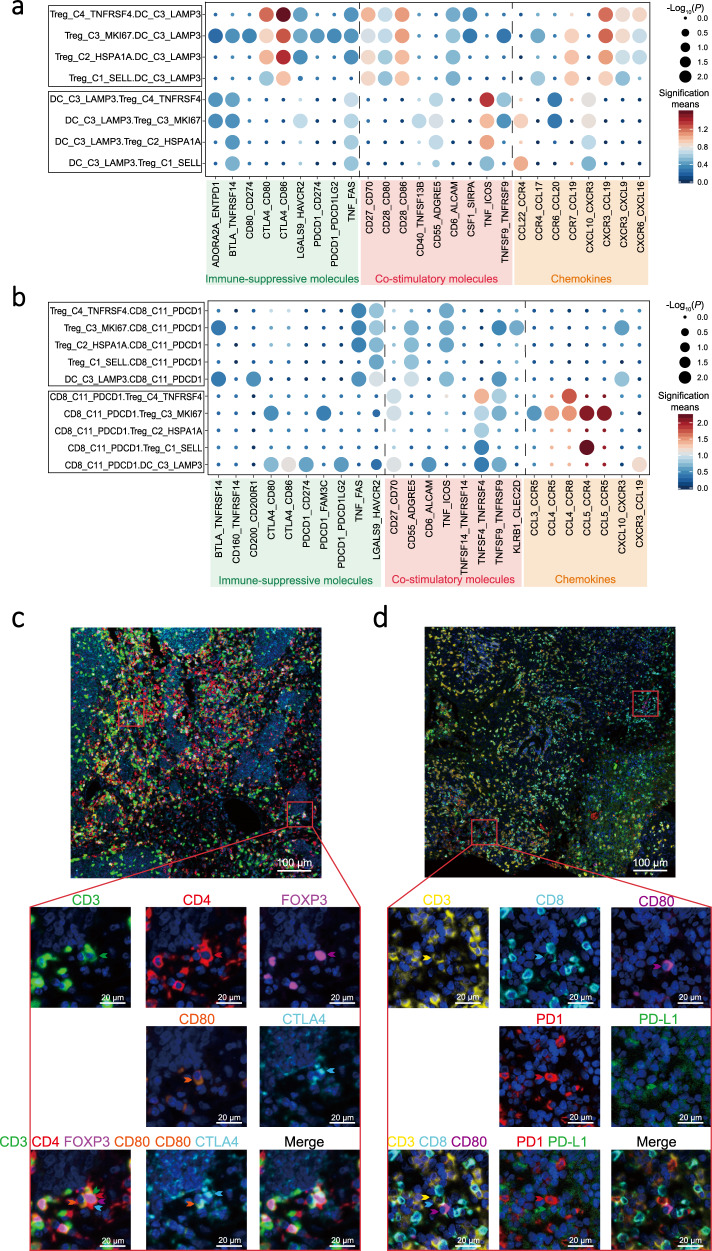
Fig. 6. Intercellular interactions among immune and malignant cells in NPC.
a, b Dot plots showed selected ligand-receptor interactions between two cell clusters, for Treg and DC_C3_LAMP3 cells (a) and for exhausted CD8+ T (CD8_C11_PDCD1) and DC_C3_LAMP3 cells (b). The ligand-receptor interactions and cell-cell interactions are indicated at columns and rows, respectively. The means of the average expression levels of two interacting molecules are indicated by colour heatmap (right panel), with blue to red representing low to high expression. The log10(P-values) were indicated by circle size in one-sided permutation test. Different colour boxes at the bottom represent different function modules of receptor-ligand interactions. c Representative images of multiplex IHC staining for the juxtaposition of CTLA4-expressing Treg cells (CD3+CD4+FOXP3+) and CD80-expressing DC_C3_LAMP3 cells in NPC tissue samples. Proteins detected using respective antibodies are indicated on top. The green, red, magenta, cyan, and orange arrows indicated positive cells with the expression of CD3, CD4, FOXP3, CTLA4, and CD80 proteins in NPC tissue, respectively (bottom panel). Images are representative of three biological replicates. Scale bars, 100 µm and 20 µm for top and bottom panels, respectively. d Representative images of multiplex IHC staining for the juxtaposition of PD1-expressing CD8+ T cells (CD3+CD8+) and PD-L1-expressing DC_C3_LAMP3 cells (CD80+) in NPC tissue samples. Proteins detected using respective antibodies are indicated on top. The yellow, cyan, magenta, red, and green arrows indicated positive cells with the expression of CD3, CD8, CD80, PD1, and PD-L1 proteins in NPC tissue, respectively (bottom panel). Images are representative of three biological replicates. Scale bars, 100 and 20 µm for top and bottom panels, respectively.

