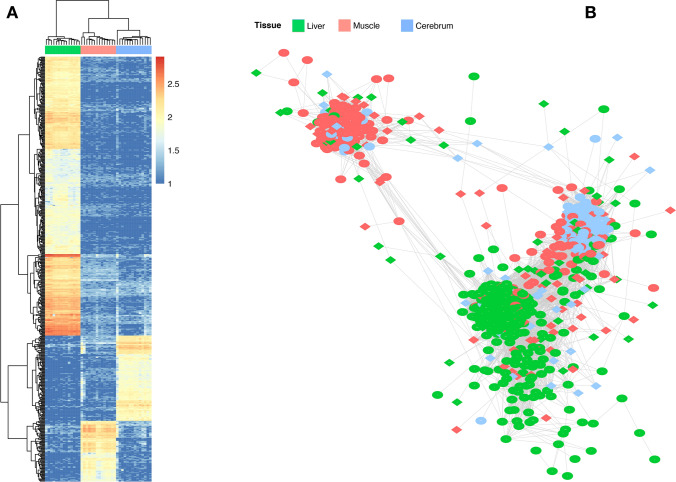
Figure 2.
Tissue-to-tissue co-expression network of the bovine fetal organ transcriptome. (A) Heat map of 553 tissue-specific genes from the liver, muscle, and cerebrum tissues. (B) Co-expression network of 992 significantly co-expressed genes. Only nodes with a correlation greater than |0.9| are shown. Overlapped genes between analysis were colored based on the tissue with its maximum expression. Transcription factors are represented by a diamond shape. Nodes with few connections not linked to the main network are not showed. Heat map was constructed using pheatmap v.1.010.93 on R79, whereas gene network was created on Cytoscape v.3.789.

