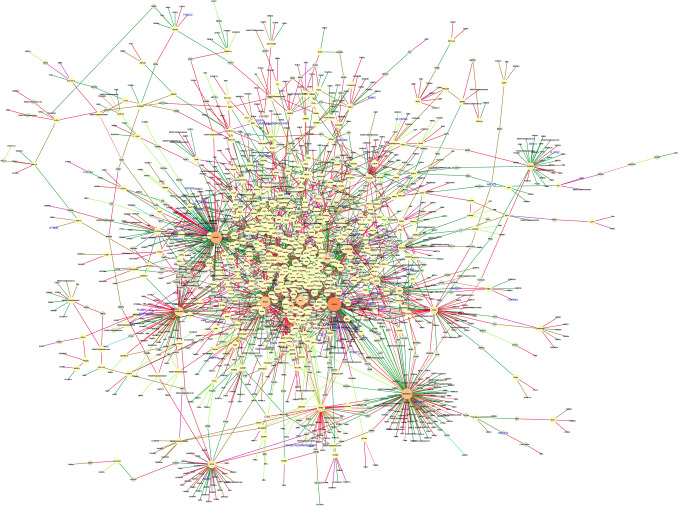
Figure 5.
Liver regulatory network of differentially co-expressed genes from the bovine transcriptome. Nodes are genes with significant changes in the correlation between control and nutrient restricted fetus (q ≤ 0.05). The node size and color (from light to dark) are proportional to the number of connections for each gene. Nodes with few connections not linked to the main network are not showed. Transcription factors are represented by a diamond shape. Differentially expressed genes are labeled in blue. Edges are colored based on the differential correlation class (+/− , red; + /0, salmon; − /+ , green; − /0, green-yellow; 0/+ , magenta; 0/− , brown). Gene network was created on Cytoscape v.3.789.

