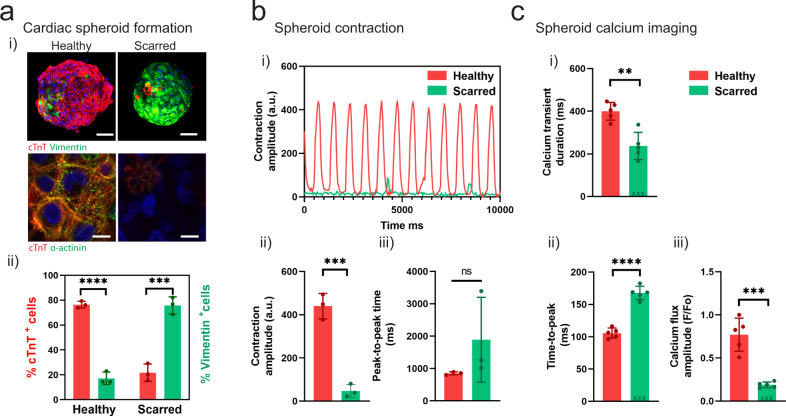
Fig. 4. Fabrication of cardiac spheroids for disease modeling applications.
a (i) Development of healthy and scarred spheroids through mixing iPSC-derived cardiomyocytes (iPSC-CMs) with primary adult cardiac fibroblasts (CFs) at defined ratios of cell numbers (4:1 for healthy; 1:4 for scarred). Top: Images (cardiac troponin-T (cTnT) (red; iPSC-CMs); vimentin (green; CFs)) taken 3 days after cell seeding. Scalebar 50 µm. Bottom: Immunofluorescence staining for alpha-actinin (green; sarcomeres) and cTnT (red; iPSC-CMs) in healthy and scarred spheroids at 3 days. Scalebar 10 µm. (ii) Quantification of cellular composition through staining for cTnT (iPSC-CMs) and vimentin (CFs) (n = 3 biologically independent samples, mean ± s.d, two-sided student t test, healthy - cTnT+ vs. Vimentin+ p = 5.6 × 10⁻⁵, scarred - cTnT+ vs. Vimentin+ p = 6.7 × 10⁻⁴). b (i) Contraction profiles, (ii) contraction amplitude (a.u. absolute units), and (iii) peak-to-peak time (ms) of healthy and scarred cardiac spheroids at 3 days (n = 3 biologically independent samples, mean ± s.d, two-sided student t test, (ii) p = 5.0 × 10⁻⁴). c Quantification of calcium activation parameters from calcium mapping experiments in healthy and scarred spheroids at 3 days, including (i) calcium transient duration (ms), (ii) time-to-peak (ms), and (iii) calcium flux amplitude (F/Fo) (n = 5 biologically independent samples, mean ± s.d, two-sided student t test, (i) p = 0.0014, (ii) p = 5.0 × 10⁻⁶, (iii) p = 2.0 × 10⁻⁴). Note for n = 3 scarred spheroids a significant calcium activation peak was not observed, and these samples were not included in the statistical analysis and are denoted by x mark on the graph. All experiments are from a single iPSC-CM donor (donor A). (n.s. not significant, **p < 0.01, *** p < 0.001, **** p < 0.0001).

