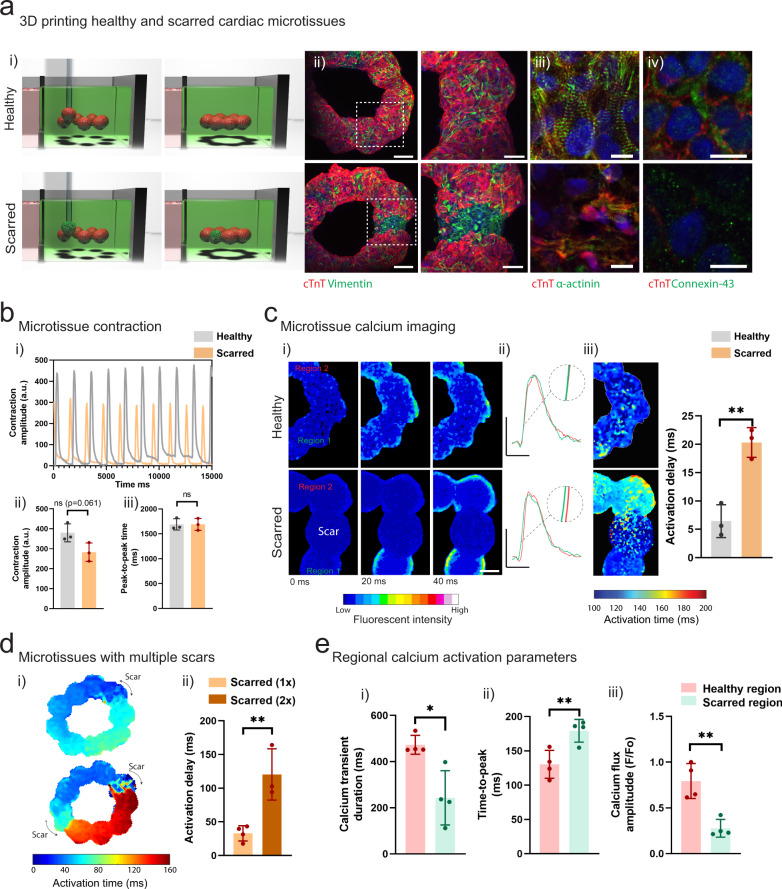
Fig. 5. 3D bioprinting cardiac microtissues for disease modeling applications.
a (i) Schematic of 3D bioprinting of healthy and scarred cardiac microtissue rings and (ii) immunofluorescence staining for cTnT and vimentin in healthy and scarred cardiac microtissues after 5 days of fusion within the support hydrogel. Scalebar 100 µm (insets 50 µm). (iii) Immunofluorescence staining for alpha-actinin (green; sarcomeres) and cTnT (red; iPSC-CMs) and (iv) connexin-43 (green; gap junctions) and cTnT (red; iPSC-CMs), in healthy and scarred regions of microtissues after 5 days of fusion within the support hydrogel. Scalebar 10 µm. b (i) Contraction profiles of healthy and scarred cardiac microtissues following removal from the support hydrogel after 5 days of culture. (ii) Contraction amplitude (a.u. absolute units) and (iii) Peak-to-peak time (ms) at 5 days (n = 3 biologically independent samples, mean ± s.d, two-sided student t test, (ii) p = 0.061). c (i) Calcium mapping in healthy and scarred cardiac microtissues after 5 days culture, each image represents a 20 ms frame. Scalebar 100 µm. (ii) Representative calcium traces from regions 1 and 2 (see methods) in healthy and scarred cardiac microtissues. Scalebars 0.5 ΔF/Fo (y), 500 ms (x). (iii) Activation maps of healthy and scarred cardiac microtissues, and activation delay (ms) (difference in activation time (ms) between regions 1 and 2) in healthy and scarred cardiac microtissues (n = 3 biologically independent samples, mean ± s.d, two-sided student t test, p = 0.0035). d (i) Activation maps of scarred cardiac microtissues with 1 or 2 scars after 5 days of culture and (ii) quantification of activation delay (ms) (n = 3-4 biologically independent samples, mean ± s.d, two-sided student t test, p = 0.0066). e Regional quantification of (i) calcium transient duration (ms), (ii) time-to-peak (ms), and (iii) calcium flux amplitude (F/Fo), in healthy and scarred regions of microtissues (scarred 1x) after 5 days of culture (n = 4 biologically independent samples, mean ± s.d, two-sided student t test, (i) p = 0.010, (ii) p = 0.0098, (iii) p = 0.0029). Note full calcium transient duration, time-to-peak, and activation maps can be found in Supplementary Fig. 8. All experiments from a single iPSC-CM donor (donor A). (n.s. not significant, *p < 0.05, **p < 0.01).

