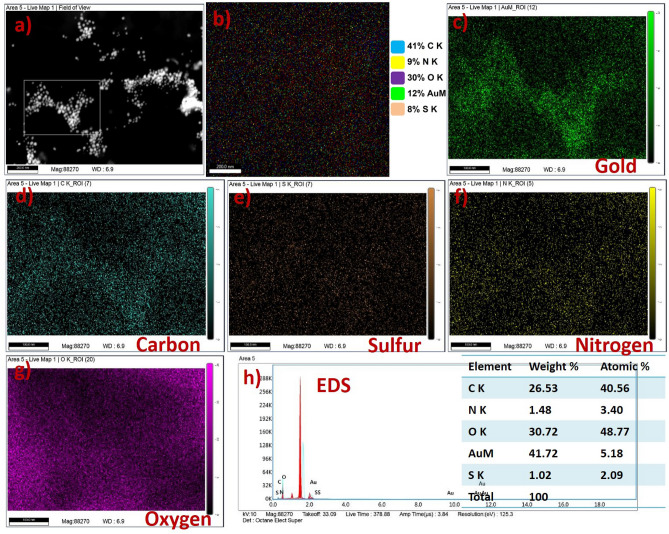
Figure 6.
FESEM image and Elemental mapping with EDS spectrum of gold nanoformulations, (a) high magnification image gold nanoformulations with selected area for mapping analysis, (b) Elemental mapping images of gold nanoformulations with corresponding elements (C K = 41%, N K = 9%, O K = 30%, AuM = 12% and S K = 8%), (c) mapping image of metallic gold nanoparticles, (d) carbon, (e) sulfur, (f) nitrogen, (g) oxygen and (h) EDS spectrum of gold nanoformulations.

