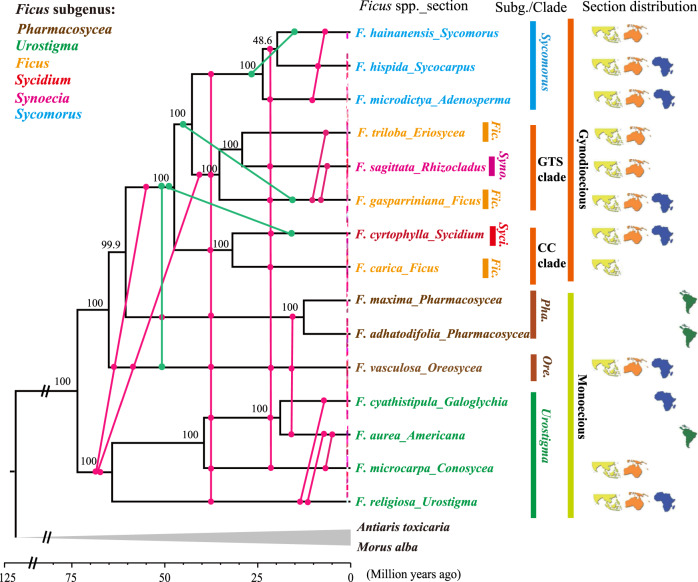
Fig. 2. Hybridization events within Ficus inferred with ABBA-BABA D-statistics and PhyloNetworks exhibited on the Astral tree.
The Astral Ficus species tree (indicated with horizontal lines) inferred based on the non-overlapping 100-kb-windows nuclear genome datasets, with bootstrap values at nodes. The vertical lines in the tree represent the hybridization events inferred with ABBA-BABA D-statistics alone (rose-red lines and dots) or with both the D-statistics and PhyloNetworks (green lines and dots). For all pairs of species or clades with a dot where a vertical line crosses the (horizontal) branch indicating the species or clade, hybridization was detected involving taxa connected by the same vertical line. The dashed rose-red line near the tips of branches indicates that signals of hybridization could be detected among almost all species across different subgenera with D-statistics. Points where vertical lines contact branches do not reflect the precise estimated time of hybridization, but rather a time interval (between stem and crown age of related taxa) during which hybridization occurred. Current distribution range of related section (map symbols) and the subgenera information (tip name color) of sampled species are also shown. Ficus classification and current distribution at the section level are also shown. Refer to Supplementary Data 1 and 2 and Appendices 2 and 6 for details.

