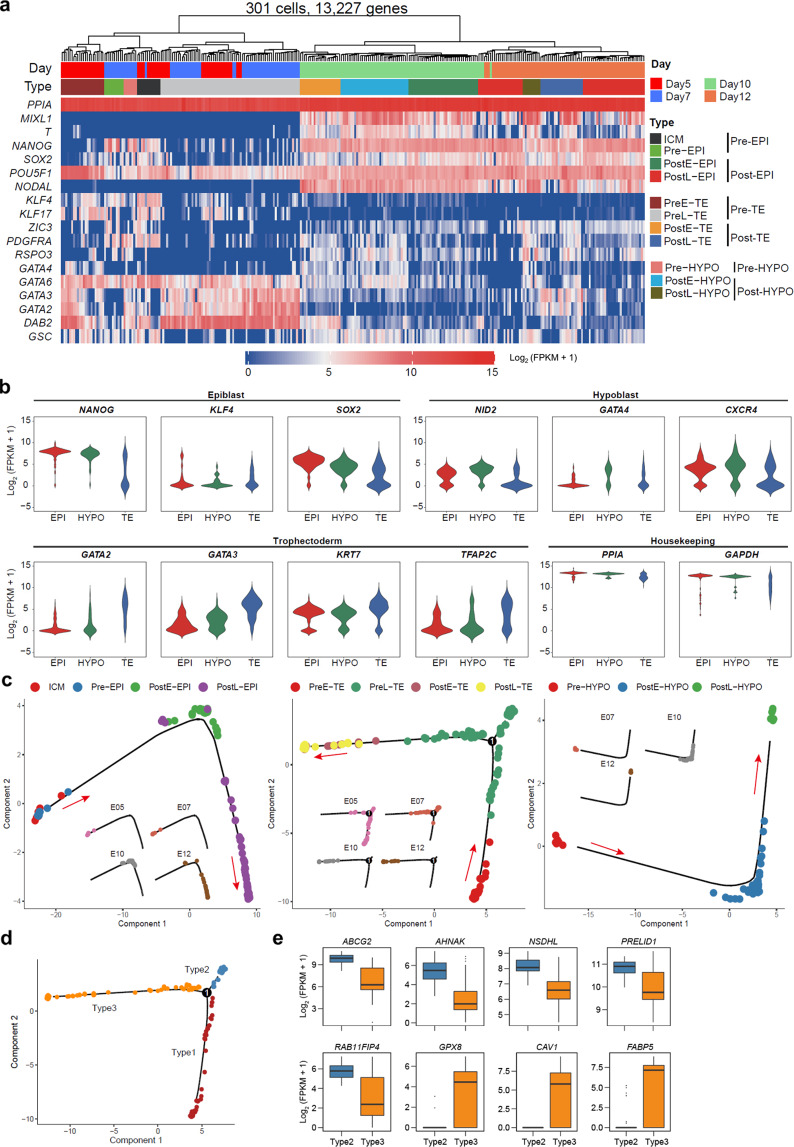
Fig. 2. Lineage specification in pig embryos.
a Unsupervised hierarchical clustering (UHC) with all expressed genes (301 cells, 13,227 genes) and a heatmap of the levels of selected marker genes. Color bars under the dendrogram indicate embryonic days (top) and cell types (bottom), respectively. b Violin plots of the expression of selected lineage specifier genes. c The development trajectory of each lineage based on psudotime analysis using Monocle2. d Cell types defined in the developmental trajectory according to the different branches of TE cells in c. e Expression patterns of mural TE- and polar TE-related genes in type 2 and 3 TEs. Stage information was indicated as follows: Pre-, Day 5 or/and Day 7; PreE-, Day 5; PreL-, Day 7; Post-, Day 10 and Day 12; PostE-, Day 10; PostL-, Day 12.

