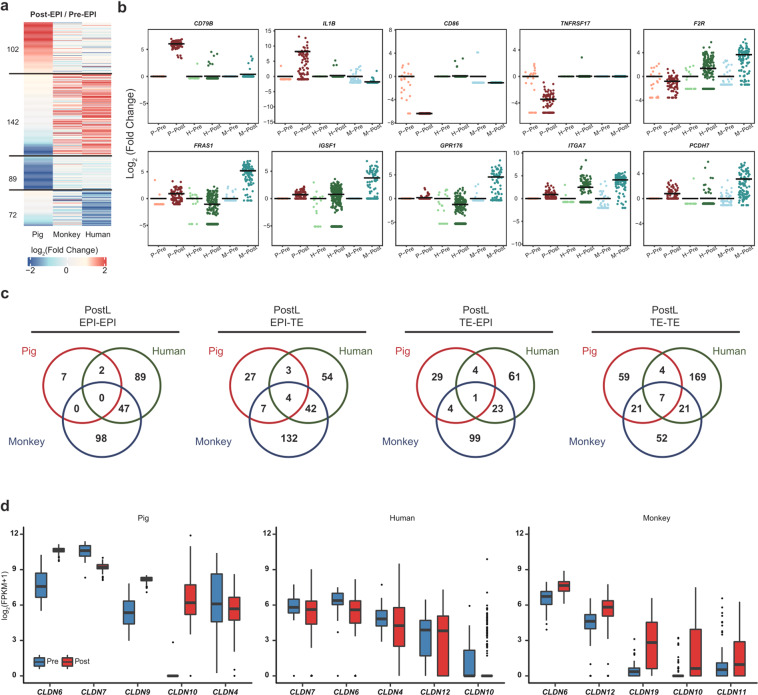
Fig. 5. Cross-species comparison of membrane-related genes among pig, monkey and human EPIs.
a Heatmap of differential expression of cell surface proteins in Pre- and Post-EPIs in pig, human, and monkey. b Scatter-plot of genes encoding species-specific surface proteins. P-Pre, pig ICM and Pre- EPIs; P-Post, pig PostE- and PostL- EPIs; H-Pre, human D6-EPIs; H-Post, human D8- and D10-EPIs; M-Pre, monkey ICM and Pre-EPIs; M-Post, monkey PostE- and PostL-EPIs. Using Pre-EPIs as a control, fold change of gene expression in each cell relative to the average expression level in Pre-EPIs was calculated. c Overlaps of the interaction relationship between PostL-EPIs and PostL-TEs in each species. d Box plot showing the expression of top 5 claudin genes in Pre- and Post- EPIs in each species. Stage information was indicated as follows: Pre-, Day 5 or/and Day 7, PreE-, Day 5; PreL-, Day 7; Post-, Day 10 and Day 12; PostE-, Day 10; PostL-, Day 12. The horizontal lines in b indicate the mean values. To avoid the influence caused by the “0” value, a new matrix was generated by using FPKM + 1 and the log2-transformed fold change was calculated.

