
Fig. 5. Docking models of the PARP1 – HPF1 – PARPi complexes.
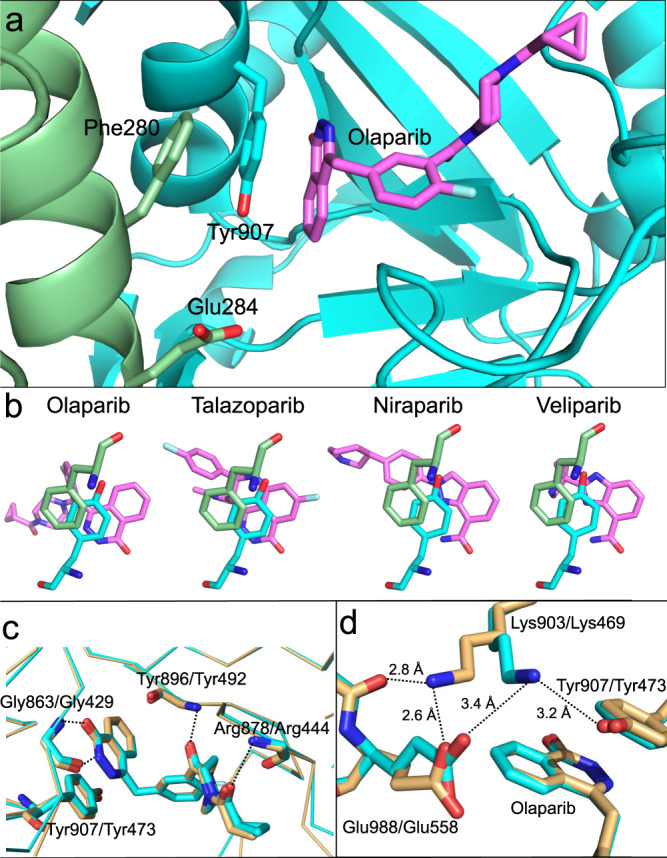
a Model of the PARP1 active site (in cyan) bound to olaparib (in violet) and docked to HPF1 (in green) showing the pi-pi-pi stack that may explain the increased affinity of olaparib for PARP1 in the presence of HPF1. The catalytic base of HPF1 (Glu284) is the closest residue to olaparib but makes no direct contacts (>6 Å). b Olaparib and talazoparib both have pi-pi-pi stacks between Phe280 of HPF1 (in green), Tyr907 of PARP1 (in cyan), and the PARPi (in violet), whereas for niraparib and veliparib this stacking interaction is not as well aligned due to differences in the ring systems. c Overlay of the structures of PARP1 (pdb id = 5ds3) and PARP2 (pdb id = 4tvj) both with bound olaparib demonstrating the nearly identical interactions of all active site residues that make direct contact with the inhibitor. The H-bonds shown are all with backbone atoms and the pi-stacking tyrosine is also shown. The backbone trace is shown to emphasize the overall similarity in the catalytic domains (RMSD = 0.55 Å). d Representation of the proposed “lysine lock” that may explain why HPF1 affects the inhibition by olaparib of PARP1 (in cyan) but not PARP2 (in light orange).