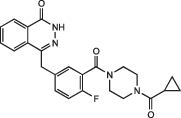
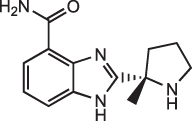
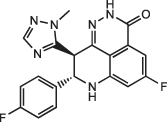
Table 1.
KI values (with standard deviations) for PARPi binding to PARP1 and PARP2 alone or in the presence of HPF1.
| PARP1 | PARP2 | ||||||
|---|---|---|---|---|---|---|---|
| PARPi | Structure | Ki (nM) | Ki + HPF1 (nM) | Fold (t-test) |
Ki (nM) | Ki + HPF1 (nM) |
Fold |
| Olaparib |  |
0.97 ± 0.17 (n = 6) |
0.20 ± 0.01 (n = 4) |
4.8 *** |
0.34 ± 0.06 (n = 4) |
0.39 ± 0.10 (n = 4) |
0.88 n.s. |
| AZD-2461 |  |
2.2 ± 0.6 (n = 6) |
0.78 ± 0.14 (n = 4) |
2.9 ** |
n.d. | n.d | |
| A-966492 |  |
0.69 ± 0.12 (n = 3) |
0.32 ± 0.05 (n = 3) |
2.2 ** |
n.d. | n.d. | |
| Niraparib |  |
1.2 ± 0.4 (n = 5) |
0.64 ± 0.03 (n = 3) |
1.8 ** |
n.d. | n.d. | |
| Veliparib |  |
0.96 ± 0.08 (n = 5) |
0.78 ± 0.07 (n = 4) |
1.2 n.s. |
9.9 ± 2.8 (n = 4) |
2.9 ± 2.5 (n = 4) |
1.7 n.s. |
| Rucaparib |  |
0.09 ± 0.04 (n = 6) |
0.07 ± 0.02 (n = 5) |
1.4 n.s. |
n.d. | n.d. | |
| Talazoparib |  |
0.012 ± 0.003 (n = 4) |
0.011 ± 0.005 (n = 4) |
1.1 n.s. |
0.18 ± 0.04 (n = 3) |
0.15 ± 0.03 (n = 3) |
1.2 n.s. |
All values were determined from replots as shown in Fig. 2. The number of replicates for each experiment is indicated, as well as the fold-difference caused by the addition of HPF1. Pairwise comparisons were evaluated using the two-sided student t test, as indicated by the asterisks: **P < 0.01, ***P < 0.001.
