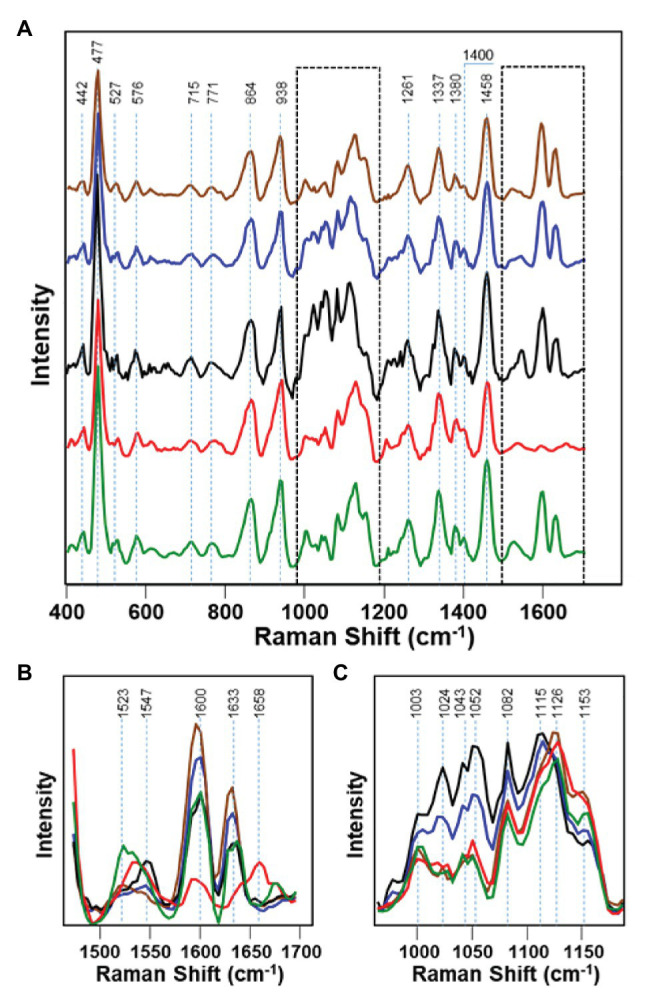
Figure 5.

Raman spectra of healthy maize kernels (green) and maize kernels infected by Aspergillus niger (brown), A. flavus (blue), Diplodia spp. (black), and Fusarium spp. (red). 1450-1700 cm-1 and 950-1200 spectral regions shown by dashed lines in the panel A are magnified in panels B and C, respectively. Reproduced with permission from Farber and Kurouski, (2018).
