Figure 6.

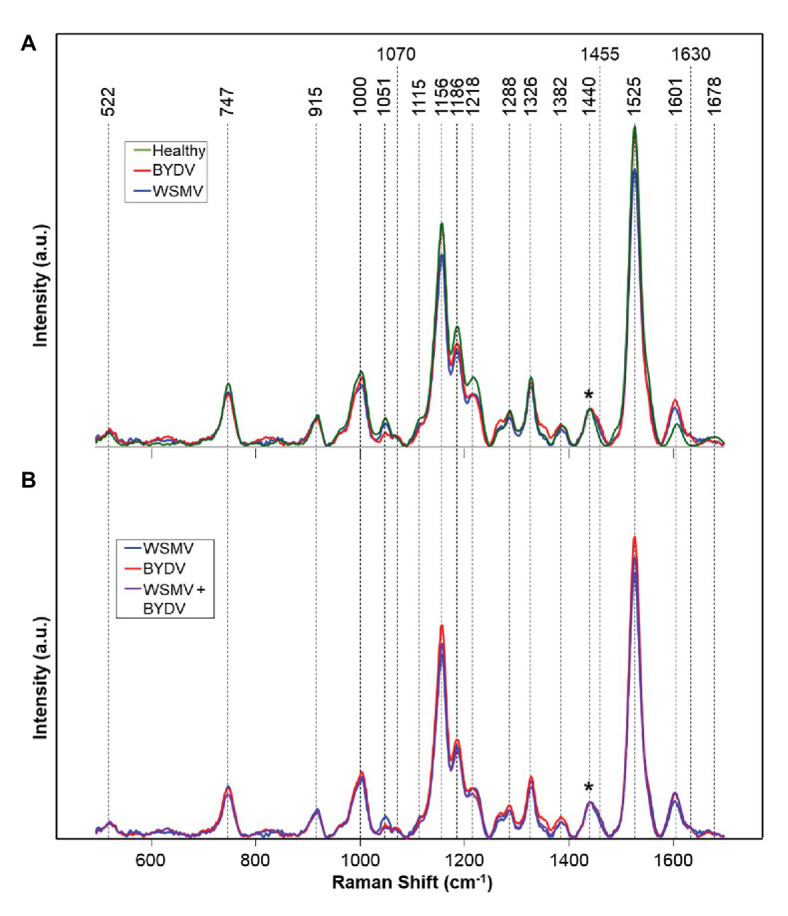
Raman spectra of: (A) Healthy and WSMV- or BYDV-infected wheat leaves and (B) the combination of these two viruses. Normalization band at 1,440 cm−1 is marked by an asterisk (*).

Raman spectra of: (A) Healthy and WSMV- or BYDV-infected wheat leaves and (B) the combination of these two viruses. Normalization band at 1,440 cm−1 is marked by an asterisk (*).