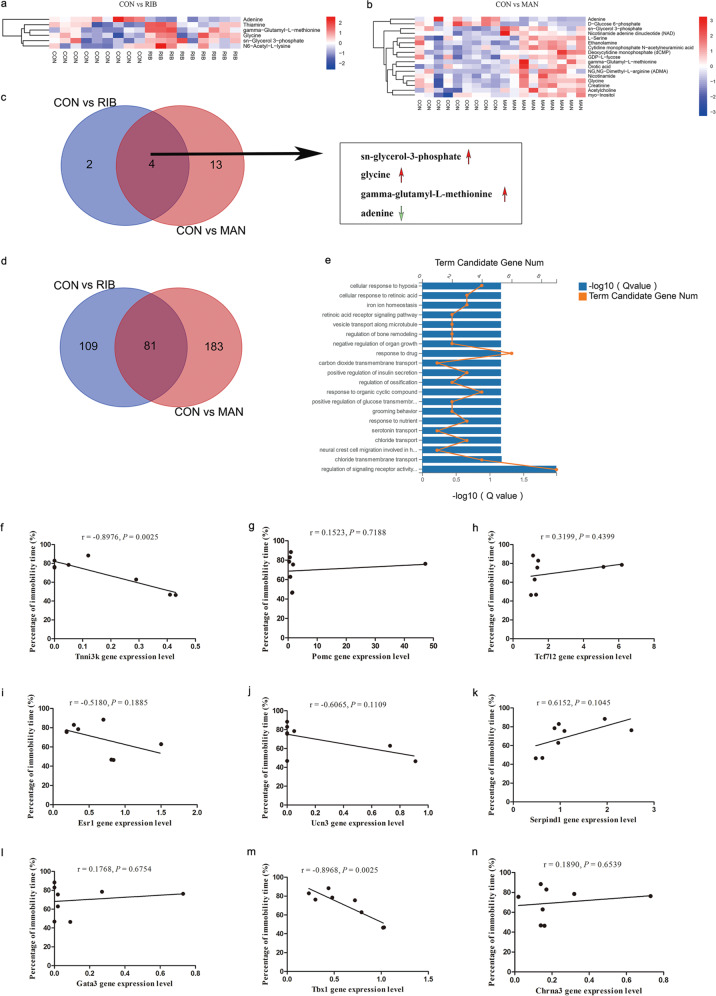
Fig. 3. Widely targeted metabolomics and transcriptomics analysis of hippocampus from 4 g/kg d-ribose (RIB), 4.8 g/kg d-mannose (MAN) and control (CON) groups mice.
a, b Heatmap of the six differentially expressed metabolites (DEMs) from the RIB versus CON a groups, and the 17 DEMs from the MAN versus CON b groups. The rows indicate the metabolites, and the columns indicate the samples of each group. c The Venn diagram indicates the three upregulated (sn-glycerol-3-phosphate, glycine and gamma-glutamyl-l-methionine) and one downregulated (adenine) metabolites in both the RIB and MAN groups. d The Venn diagram showing the 81 differentially expressed genes (DEGs) common to both the RIB and MAN groups. e Top 20 GO biological processes of the 81 genes altered in both the RIB and MAN groups (P < 0.05). f–n Correlations between the nine altered genes (Tnni3k (f), Pomc (g), Tcf7l2 (h), Esr1 (i), Ucn3 (j), Serpind1 (k), Gata3 (l), Tbx1 (m), and Chrna3 (n)) in the hippocampus and the percentage of immobility time of mice in the CON and RIB groups (n = 4 each group). Chrna3 cholinergic receptor nicotinic alpha 3 subunit, Esr1 estrogen receptor 1, Gata3 GATA-binding protein 3, Pomc proopiomelanocortin, Serpind1 serpin family D member 1, Tbx1 T-box transcription factor 1, Tcf7l2 transcription factor 7 like 2, Tnni3k TNNI3 interacting kinase, Ucn3 urocortin 3.

