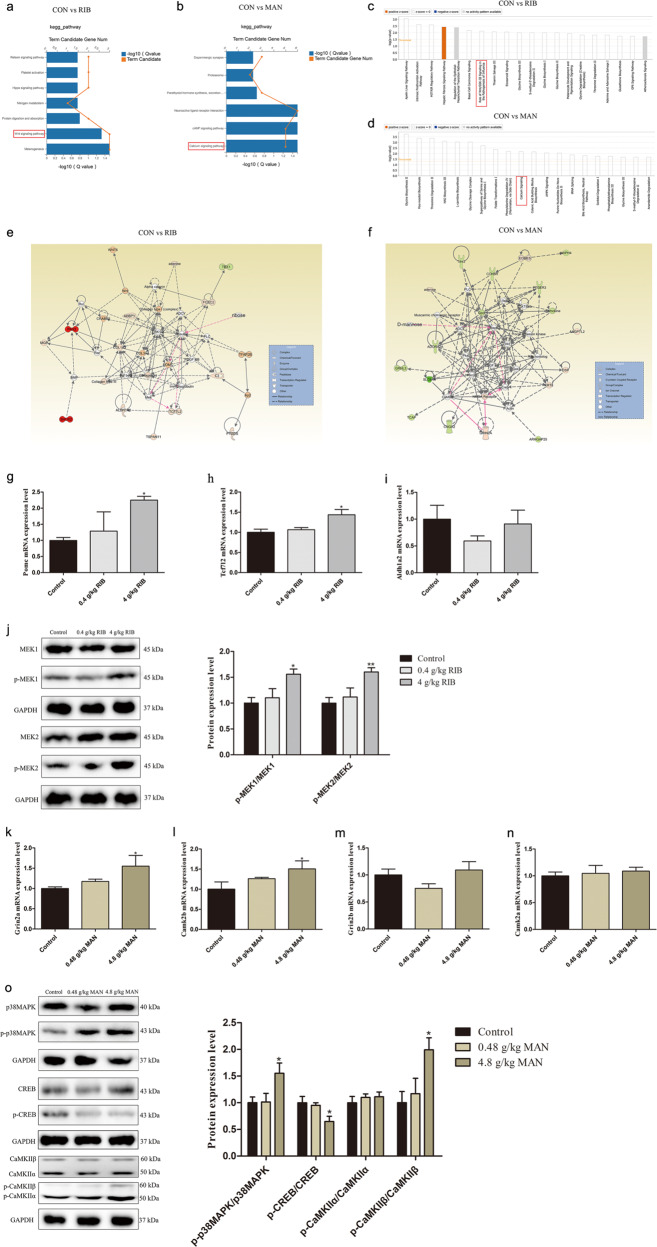
Fig. 4. Integrated analysis of widely targeted metabolomics and transcriptomics data.
a, b KEGG enrichment analysis of the selected 51 differentially expressed genes (DEGs) that were highly correlated with the differentially expressed metabolites (DEMs) from d-ribose (RIB) versus control (CON) groups (a; P < 0.05), and the selected 109 DEGs that were highly correlated with the DEMs from d-mannose (MAN) versus CON groups (b; P < 0.05). c, d Top 20 canonical pathways analysis of the selected DEGs with corresponding DEMs from RIB versus CON (c) and MAN versus CON (d) groups. e Top-ranked enriched metabolite–gene integrated network based on the selected DEGs with the corresponding DEMs from the RIB versus CON group comparison. Red lines indicate a possible insulin-POMC-MEK-TCF7L2 pathway in the underlying pathogenesis. f Top-ranked enriched metabolite–gene integrated network based on the selected DEGs with the corresponding DEMs from the MAN versus CON group comparison. Red lines indicate a possible MAPK-CREB-GRIN2A-CaMKII pathway in the underlying pathogenesis. g–i mRNA expression levels of Pomc (g), Tcf7l2 (h), and Aldh1a2 (i) in the control, 0.4 g/kg RIB and 4 g/kg RIB groups. j Phosphorylation levels of MEK1 and MEK2 in the control, 0.4 g/kg RIB and 4 g/kg RIB groups. k–n mRNA expression levels of Grin2a (k), Camk2b (l), Grin2b (m), and Camk2a (n) in the control, 0.48 g/kg MAN and 4.8 g/kg MAN groups. o Phosphorylation levels of p38MAPK, CREB, CaMKIIα, and CaMKIIβ in the control, 0.48 g/kg MAN and 4.8 g/kg MAN groups. n = 4 each group. Data represent mean ± S.E.M. * P < 0.05, **P < 0.01 versus the control group.

