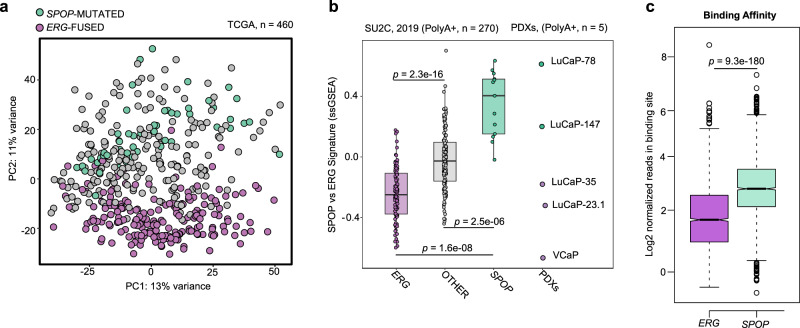
Fig. 2. Transcriptome analysis of primary prostate cancer patients reveals major differences between SPOP mutant and ERG-fused tumor subtypes.
a PCA-analysis based on RNA-Seq derived mRNA expression levels (TCGA cohort). ERG-fused (violet) and SPOP-mutant (green). Individuals were annotated into subtypes as described in Material and Methods. b Boxplots representing the transcriptional activity of SPOP integrated-signature (see Materials and Methods) applied to CRPC samples (SU2C-2019 cohort, left) and PDX-models. Scores are determined genes-signatures derived from primary prostate tumors (TCGA-cohort). ERG-fused samples are depicted in violet, SPOP-mutant samples are depicted in green. Samples not harboring SPOP mutations or ERG rearrangements are represented in gray. P-values were determined using Wilcoxon rank sum test and adjusted for multiple testing. Individual. (Boxplots, ERG: max=0.22; min = −0.75; center = −0.31; Q2 (25%) = −0.47; Q3 (75%) = −0.13, OTHER: max = 0.88; min = −0.55; center = −0.03; Q2 (25%) = −0.20; Q3 (75%) = 0.12, SPOP: max = 0.79; min = −0.02; center = 0.50; Q2 (25%) = 0.19; Q3 (75%) = 0.64.) c Boxplots depicting the number of normalized reads per binding site across all the differentially bound (DB) regions resulting from the comparison between ERG-fused (violet) and SPOP-mutant (green) samples. Analysis was restricted to DB regions showing an adjusted P-value (FDR) lower than 0.05 (as determined by DiffBind/DESeq2 pipeline). Subsequently, significance between ERG and SPOP subgroups was assessed using Wilcoxon rank sum test. (Boxplots, ERG: max = 8.14; min = −0.85; center = 1.51; Q2 (25%) = 0.74; Q3 (75%) = 2.39, SPOP: max = 7.03; min = −1.07; center = 2.76; Q2 (25%) = 2.11; Q3 (75%) = 3.48).

