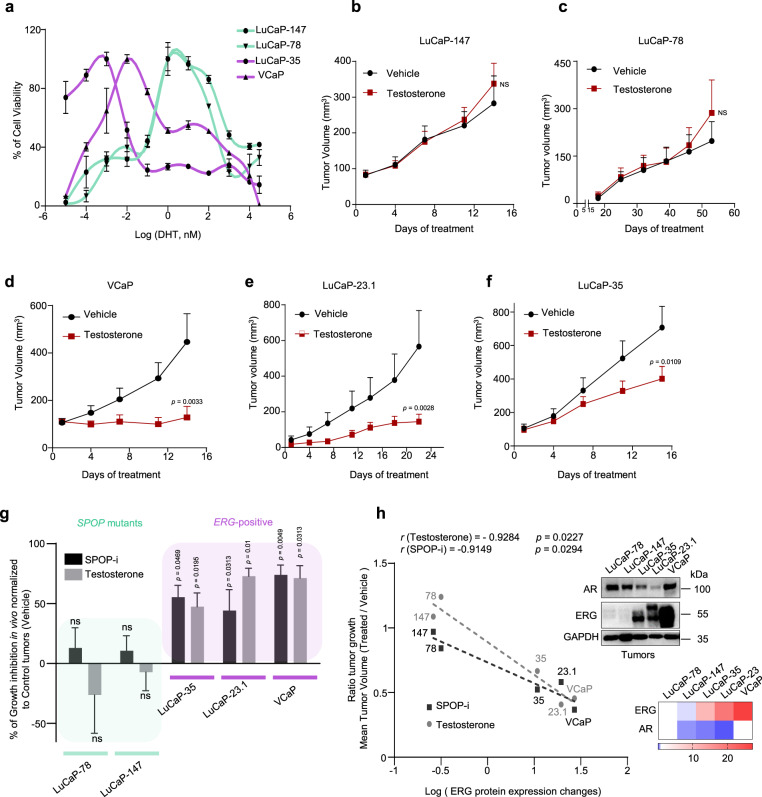
Fig. 8. ERG and mutant SPOP trigger different responses to therapeutic interventions.
a Dose–response curve to DHT treatment of VCaP, LuCaP-35, LuCaP-78, and LuCaP-147 PDX cancer cells. Before DHT treatment, PDX were grown in standard media without DHT. VCaP were starved for 24 h in CSS medium (RPMI + 10% charcoal-stripped serum). Cell viability was assessed after 2 weeks. b Tumor growth kinetics with (n = 10) or without (vehicle; n = 10) testosterone treatment in xenografts established from LuCaP-147 (SPOP-Y83C). c Tumor growth kinetics with (n = 4) or without (vehicle; n = 4) testosterone treatment in xenografts established from LuCaP-78 (SPOP-W131G) cells. d Tumor growth kinetics with (n = 6) or without (vehicle; n = 10) testosterone treatment in xenografts established from VCaP (ERG-positive) cells. e Tumor growth kinetics with (n = 12) or without (vehicle; n = 12) testosterone treatment in xenografts established from LuCaP-23.1 (ERG-positive) cells. f Tumor growth kinetics with (n = 10) or without (vehicle; n = 10) testosterone treatment in xenografts established from LuCaP-35 (ERG-positive) cells. g Sensitivity to Testosterone and SPOP-i treatment in xenograft and PDX models. LuCaP-23.1, LuCaP-35 and VCaP are ERG-positive cancer cells. LuCaP-147 and LuCaP-78 are SPOP mutant cancer cells (respectively SPOP-Y83C and SPOP-W131G). Growth inhibition is calculated using the last tumor measurements as shown in b-f and Fig. 7b–f. h Correlation of sensitivity to SPOP-i or testosterone treatment shown in Extended Data Figs. 8f–j and 9e–i, with ERG protein levels, as quantified by immunoblot, in PDX models and xenografts. P-values were calculated using Pearson rank correlation. Corresponding immunoblot and quantification of AR and ERG protein levels depicted as a heatmap. Protein expression changes were normalized to GAPDH and LuCaP-78. All error bars, mean + s.e.m. P-values were determined by two-way ANOVA with multiple comparisons and adjusted using Benjamini–Hochberg post-test (b–e) or by unpaired, two-tailed Student’s t-test (g), NS, not significant. Molecular weights are indicated in kilodaltons (kDa). Source data are provided as a Source Data File.

