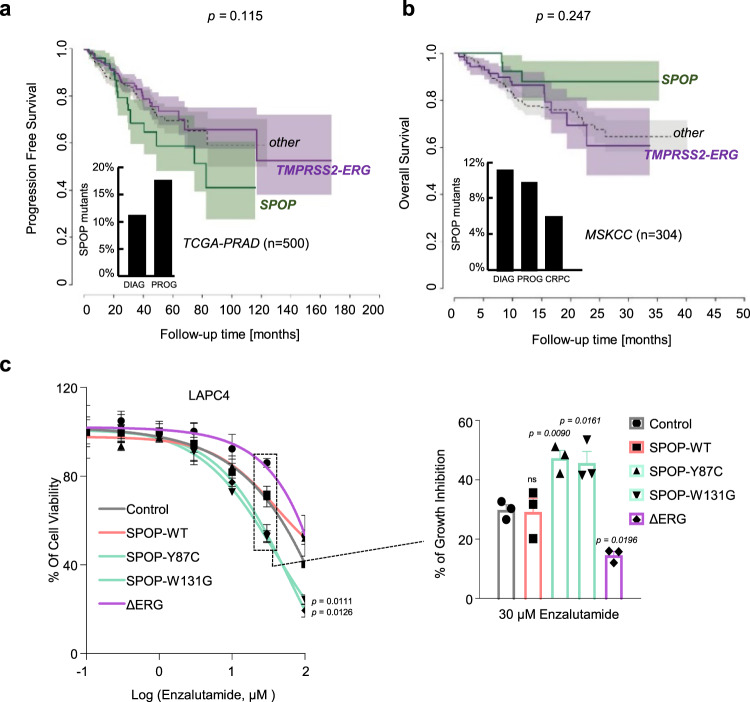
Fig. 9. SPOP mutant tumors are particularly susceptible to androgen deprivation therapies (ADT).
a Progression-free survival of prostate cancer patients derived from the TCGA-cohort. Curves representing TMPRSS2-ERG rearranged, and SPOP-mutant patients are indicated in violet and green, respectively. The area around the curves represents 80% confidence interval. The bar plot in the lower left corner indicates the percentage of SPOP-mutant tumors within all patients diagnosed with prostate cancer (DIAG) and within the individuals who developed a progression of the disease (PROG). P-values for Kaplan–Meier curves were determined using the log-rank test (P = 0.115). b Overall survival of prostate cancer patients derived from the MSK-IMPACT cohort. Curves representing TMPRSS2-ERG rearranged, and SPOP-mutant patients are indicated in violet and green, respectively. The area around the curves represents 80% confidence interval. The bar plot in the lower left corner indicates the percentage of SPOP-mutant tumors within all patients who were diagnosed with prostate cancer (DIAG), within individuals who developed a metastatic progression of the disease (PROG), and within individuals who developed castration-resistant prostate cancer (CRPC). P-values for Kaplan–Meier curves were determined using the log-rank test. (P = 0.247). c Enzalutamide sensitivity of LAPC4 cells overexpressing ΔERG or SPOP mutant species (Y87C, W131G). All error bars, mean + s.e.m. P-values were determined by unpaired, two-tailed Student’s t-test (c), NS, not significant.

