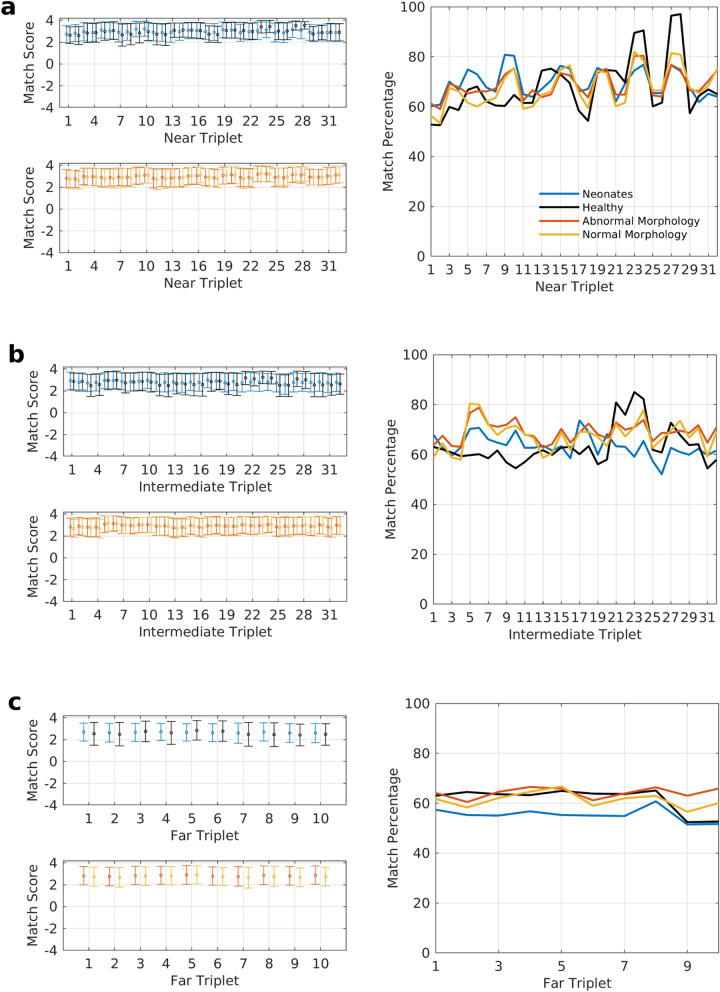
Figure 4.
Match scores and match percentages for near, intermediate and far sets of triplets for data sets 2–4. The triplets have been assigned to their respective sets based on the mutual separation of the electrodes within a triplet. Each triplet in the three sets is represented by a number given in Supplementary Table S2. Consecutive odd and even numbered triplets are mirror images of each other in the two opposing cerebral hemispheres. The error bars represent 1 standard deviation. (a) Match scores and percentages for triplets in the near set. The triplets are arranged such that traversing towards the right on the x-axis corresponds to moving from the frontal portion of the scalp to the back. (b) Match scores and percentages for triplets in the intermediate set. With 2410 EEG records of 2356 subjects in the three data sets, 32 triplets for each record, and six permutations per triplet, (a,b) represent statistics of 462,720 connectivity patterns each. c Match scores and percentages of 144,600 connectivity patterns in the far set with 10 triplets.

