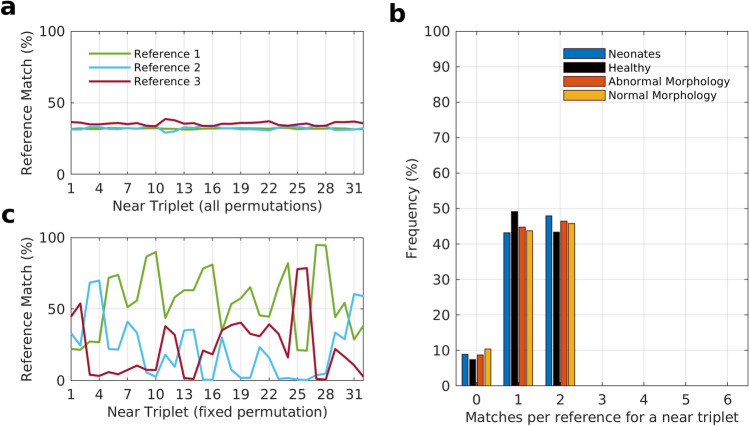
Figure 5.
The prevalence of the three reference patterns relative to each other in the near set of triplets. (a) The percentage frequency with which each of the three references are observed across all permutations of a triplet (near) in data sets 2–4. The connectivity patterns of all six permutations at each triplet location that gave a statistically significant match were selected from the three data sets. The particular reference out of three that each pattern best matched with was noted and is shown as percentage frequency for all the three data sets. (b) Histogram for the number of permutations, among the six available per triplet, that matched with each of the three references. All three references are represented in this single histogram. A reference can match with anywhere between zero to all six permutations of a triplet. The histogram was constructed for a total of 77,120 triplets across all EEG records in data sets 2–4. (c) The percentage frequency with which each of the three references is observed in a fixed permutation of a triplet (near) across data sets 2–4. A particular permutation out of the six available for each triplet was arbitrarily chosen and kept fixed, unlike a where all six permutations were considered.

